Merging Data and Design with the Ventuz Software Suite
| Date: 7th December 2018 |
| Technology: Data Visualization, Interactive |
Data: it is the source of all knowledge, the nature of information, infinitely interesting. Sadly, decades of poor presentation techniques have left audiences under the impression that data is boring, simply because it was boring to look at. As a result, we are confronted with the same question every time we are preparing any form of presentation: How do I make this look as interesting as it actually is? At Ventuz, we have given this question a lot of thought and have implemented many workflow improvements and integrations into Ventuz that are specifically aimed at the dynamic visualization of live data.
Data Integration
Data can come from a multitude of sources, which is why Ventuz offers an open I/O structure that allows for the input of data through various channels. These include bi-directional communication with databases – MS-SQL, ODBC, OleDB, Oracle, and MySQL – but also more amendable file formats like Excel, TXT files or XML. In addition, users can integrate other data sources by scripting their own API. Naturally, the internet – the largest source for data in the world – can be used to drive Ventuz content as well. Here, web browsers allow direct access, while RSS and JSON feeds as well as social media integration can bring live information into any given project.
The advantage of using a real-time engine really unfolds when we operate with dynamic data that is continuously updated – stock figures, current sales numbers, votings and the like. We want to present the latest and most relevant information. With every rendered frame, Ventuz rechecks the data source and uses the latest data input to generate graphics. This can happen automatically, so that no manual intervention is necessary. If, however, more control is required, Ventuz enables easy integration of data curating tools.
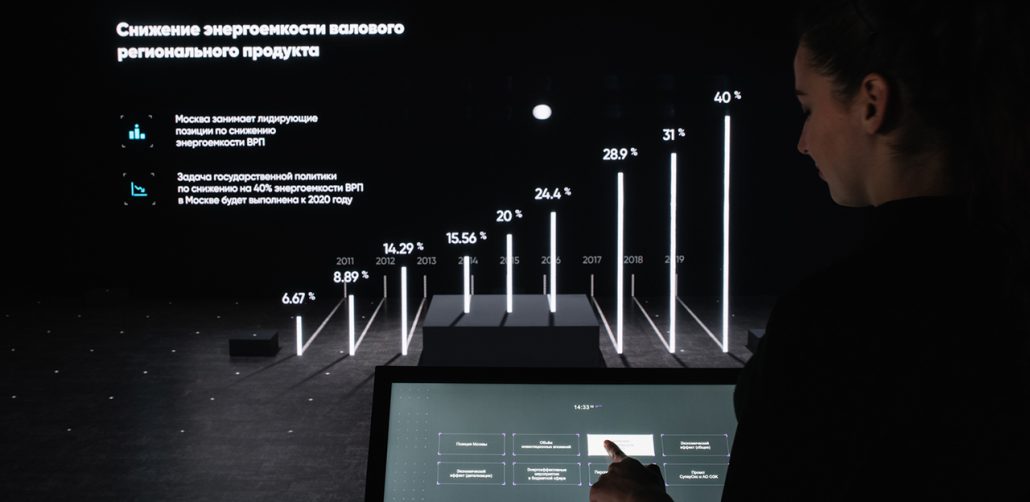
How to visualize data
The question remains: How do we make this look interesting? Let’s face it, we all have seen our fair share of pie and bar charts, and although they might be informative and a good solution in many cases, they cannot wow an audience anymore. Instead, modern VFX methods offer brand new and exciting ways to bring data into a visual form.
One such solution is a particle engine, as was introduced in Ventuz earlier this year. Data driven particles allow you to visualize complex data, such as characteristics of client groups, growth patterns and more, in the form of dynamic point clouds. By linking the live data source directly to the particle system, the audience can watch shifts and changes as they occur and get a much more accurate idea of what meaning is behind the numbers. Plus, it looks really cool.
Another way to visualize data is to link it to animations, colors or other characteristics of the content. If you want to show improvements in speed, why not link them to the actual animation speed of an object instead of showing a percentage number? By using a more physical approach to the visualization of data, we tap into people’s natural understanding of the world and allow them to easily grasp what we want to communicate.
Ventuz adds to this a philosophy of creative freedom and high-end design options. With the common workflows of designers and 3D artists in mind, the software supports efficient pipelines to other creation tools such as Photoshop, Cinema 4D and other 3D modeling packages, as well as more traditional, video-centric workflows including live and streaming video. This allows users to bring the very best content together in Ventuz, author it to perfection and add dynamic data to bring it to life.
Use Cases
Dynamic data visualization is used in a number of scenarios, ranging from large stage events to single-user info points. Especially at trade shows, companies like to show their product portfolio on a touch screen or info terminal to inform visitors even when no staff member is available for a personal conversation. By attaching this installation to the company’s merchandise management system, all product information is always up to date, even when the application is taken on a roadshow and no technical personnel is on site to adjust the content.
Naturally, corporate presentations are usually ripe with data. They are also an intricate enterprise: their purpose is to entertain as much as inform the audience, hold attention and deliver the message in a limited amount of time. And, they should be memorable. By combining live data inputs with breathtaking visual effects and unusual stage setups, all of this can be achieved out of the Ventuz Software Suite.
But visually appealing data visualization is not just relevant when presenting your company to the outside world. A lot of data is going into control rooms and internal events to analyze sales activities or celebrate achievements. Here, the infinite design opportunities in Ventuz allow you to find a completely individual way to bring your data onto the screens – one that highlights what is relevant for your company, that alerts at thresholds you have chosen, and that brings to light the information you really need in order to make your workflows more efficient.
Summary
The appealing visualization of dynamic live data is the key to adding an extra edge to presentation content, may it be inhouse or outbound, may it be at large events or in each individual store. The Ventuz Software Suite offers flexible ways to integrate live data into high-end 3D presentation content and visualize it in a way that not only makes it easily understandable, but also fun to look at.
Ventuz Technology will show dynamic data integrations and the new particle system at ISE 2019 on their booth in hall 8, booth number 8-K330. If you want to set up a meeting for the show, send us an email. For free entry to ISE 2019, use our VIP code 916004 when registering.


