Live Data Visualizations in Action
| Date: 19th September 2018 |
| Event: Presentations |
| Market: POS/POI |
| Technology: Data Visualization |
Data Viz is a buzz word, not only in the Ventuz offices, but all across the AV industry. Big data, live data, user data – we collect data wherever we can, but bringing it into a visually appealing form and making use of it for our communications and marketing strategy is a totally different question. At ISE 2019, we are focusing on the use of live data for presentations and interactive installations. Luckily, we can draw from the experience of the Ventuz user Community and the fascinating projects they have been involved in in 2018. Here are three examples!
The Showroom
Showrooms are a place of abundant information where companies present their portfolio to interested clients. But the details of a portfolio undergo constant changes, and having to update visual content every time is highly inefficient and probably connected to costs when a creative agency is involved. With the open data framework of Ventuz, data can easily be changed outside of the Ventuz environment without having to touch the graphics at all.
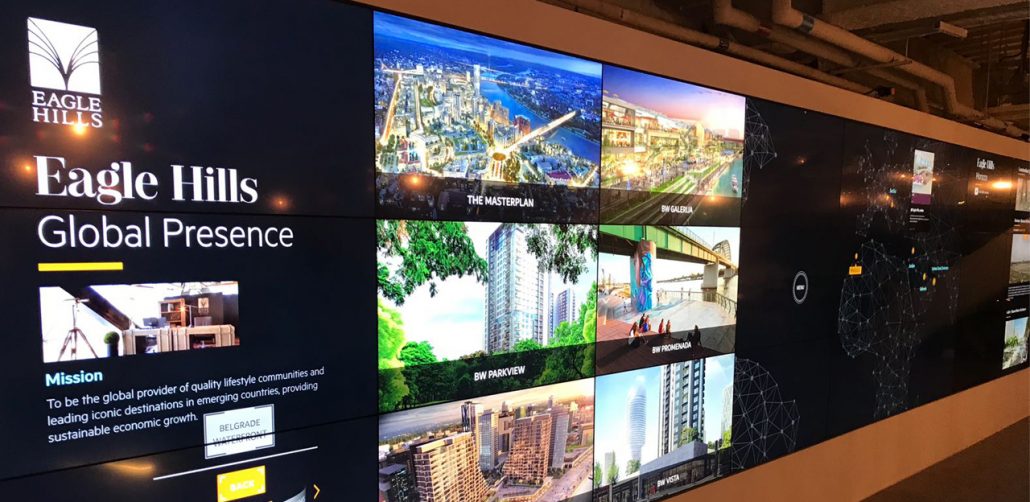
One showroom that deploys a workflow like this belongs to urban developer Eagle Hills in their headquarters in Abu Dhabi. With the help of agency Eventagrate, they are now able to virtually transport their clients across all development sites in five different countries. This is made possible via an enormous interactive video wall powered by Ventuz.
The presentations on the wall are packed with information: masterplans, images, schedules, floorplans, explanations, lifestyle videos and much more. This offers a complete picture for potential investors. The installation receives data from Excel sheets which use a carefully crafted template. By using a very accessible and widely used file format, the Eagle Hills staff can easily make adjustments or add information themselves without having to commission their creative agency Eventagrate every time.
Naturally, Ventuz also supports a variety of other data sources, such as bi-directional communication with databases – MS-SQL, ODBC, OleDB, Oracle, and MySQL –, file formats like TXT files or XML, and internet feeds.
The Point of Interest
At every trade show, companies struggle with the same issue: How do you use your limited space to present all that you have to offer? Luckily, Ventuz provides a fancy and efficient solution: the interactive product portfolio. A recent and quite interesting example was created by the agency mindstroem for agricultural engineering company Zuther.
The family-run business is specialized in farming machinery, such as silos, conveyor belts, sorting devices and the like. After several rounds of discussion and a handful of different menu designs, the agency tried a different approach: the final concept forgoes a menu altogether and instead introduces the product portfolio inside the 3D model of a machine house. Visitors can see where each product is used, maneuver through the model by touch, and select a product for closer inspection and additional information.
The data for this project was also organized through an external Excel-file, which included extra columns for localization. This feature was especially helpful for further use of the project as a tool for the sales team. Mindstroem created a downscaled version of the Ventuz project, that would run smoothly on a Microsoft Surface tablet PC. With this device at their disposal, the sales personnel can now engage and inform clients all over the world, at trade shows, roadshows or business meetings.
The Live Studio
User Generated Content and Live Streaming are primary focus points of the internet industry today. New apps are springing up left and right, and companies are coming up with ever more creative ideas to stand out from their competition. In China, the social media app Momo is now utilizing a Ventuz powered data visualization in their live studio. Agency Tunnytech was responsible for this installation.
With over 100 million monthly active users, Momo is one of the most popular social media apps in China. The Live Show is broadcast five days per week during prime time hours on the Momo app. It features one or two hosts showing their specific talent and – in the case of two participants – compete against each other for the audience’s favor. Viewers can cast their votes by awarding gifts in the form of virtual stars, cars, rockets, boats, and more.
The scores are displayed on two large LED walls in the studio. Ventuz receives the data directly from a database and uses it to calculate the according graphics in real-time. Each vote is visualized individually and accompanied by the voter’s profile picture, which offers exposure for the audience and increases retention times. Whenever an especially valuable gift is given or one of the participants meets a certain number of gifts, special animations are triggered as a form of celebration.
Here, the data is not only displayed as content (text or images), but also a source for logic in the Ventuz project. By implementing comprehensive data management into a Ventuz installation, highly automated workflows can be achieved easily. This is very interesting for the Broadcast market, but also for Digital Signage, where displays have to run independently for long periods of time.
Summary
The integration of live data into Ventuz projects allows for simplified workflows and reduced maintenance efforts in the long run, but also provides companies with solutions for presenting their portfolio to clients in showrooms, at trade shows or on the road. With a focus on high-end design and the added value of interactivity, Ventuz brings that extra pazazz to your content.
Ventuz Technology will show dynamic data integrations at ISE 2019 on their booth in hall 8, booth number 8-K330.


