Scene Statistics
The Scene Statistics dialog provides information about the nodes and their occurrence that have been used in the scene. It shows which scene components and resources use how much memory space. Additionally all assets that are used in the open Ventuz scenes are listed.
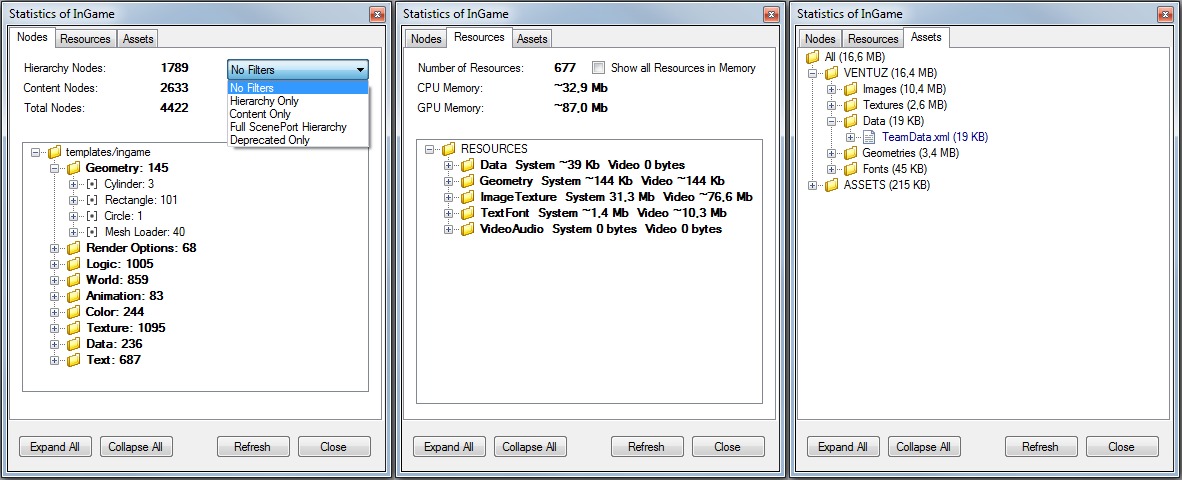
The Statistics dialog is separated into three parts.
The Nodes tab gives an overview of the nodes used in the currently open scene.
Below the summery all used nodes are listed according to their Toolbox category. The number behind the category folder is the total number of nodes from this category in the scene. If one expands the folder all used node types and their occurrence is listed. It is possible to double-click on an entry and the Hierarchy and Content Editors will navigate to the according node in the scene tree.
Additional filters can be applied to list deprecated nodes i.e, see the following list for more.
| Filter | Function |
| No Filters | All Nodes of the active scene |
| Hierarchy Only | Only Hierarchy Nodes |
| Content Only | Only Content Nodes |
| Full ScenePort Hierarchy | Nodes from the active and all nested Scenes |
| Deprecated only | Nodes of a previous Ventuz version that are no longer available |
The Resources tab shows the memory usage of all scene resources. If the Show all Resources in Memory option is enabled, all resources of all loaded scenes will be listed; otherwise only those of the active scene. The resources are assigned to different categories/folders:
- The TextFont category contains all resource which are somehow related to text rendering like texture and mesh fonts, font files, the texts itself, etc.
- Data contains all resources created by Xml, Excel and Text files but also the Shader related data.
- Geometry lists all resources built by the Geometry primitives and the Mesh Loader node.
- ImageTexture lists all resources that are related to images and textures. These are resources built by all the image and texture loader/creator/manipulator.
- VideoAudio lists all resources that are needed for video/movie and audio playback.
The memory usage of the resources is separated into the System and Video memory pools. System represents the normal CPU memory and Video the memory on graphics cards.
The Assets tab list all assets that are currently load into memory. Every asset lists all those nodes which reference this asset. The assets are sorted according to their data pools in the Project folder.
If the scene tree is modified by adding or deleting any nodes, press the Refresh button to update the statistics.