Table of Contents
Performance Statistics
The performance statistics is a display rendered above the Ventuz output. It can be enabled from the designer or the live options to analyze performance problems in a scene.
This has been enhanced as of Ventuz 4.04.00.
Displays
The performance statistics contain a lot of information. In many cases displaying it all can be a bit overwhelming and requires a lot of screen real-estate. So individual sections can be enabled and disabled:
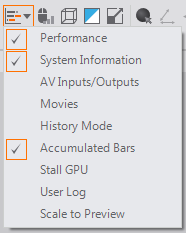
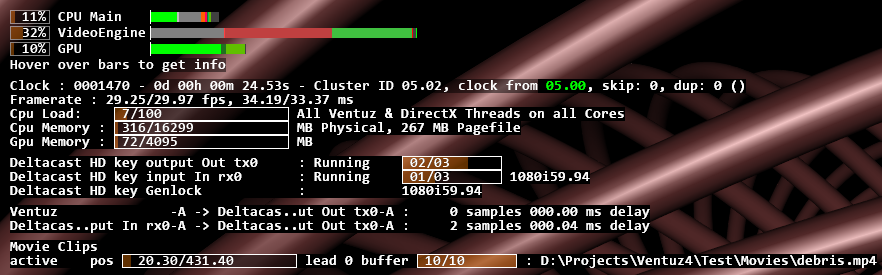
With all sections enabled, it can looks like this:
The display is updated every frame. By pressing the pause key, the update of all sections can be paused.
Here is an explanation of these sections. This is done with the drop-down button.
Performance

This gives a detailed breakdown of what happens on the main CPU thread and the GPU. If SDI boards or Webcams are in use, it will also display the timing of the Video IO thread.
The percentages are averaged over the last 64 frames. The colored bars show in more detail which part of Ventuz is performing worst. By hovering over the bars, a tool-tip explains what the bars stand for. The vertical white lines represent frames. The display is configured to show two frames, assuming you are most interested in performance when things are bad.
Please note that the performance statistics are about frames, not fields. So when running at 1080i50, expect a framerate of 25Hz, and the bars show information about rendering two fields. This is especially interesting for the video engine, as it does most of its work per frame and not per field.
In general:
- Green bars represent rendering (on CPU and GPU)
- Red bars represent validation (on CPU)
- Cyan bars represent resource generators (on CPU mostly)
- Blue bars represent idle time (only displayed when "accumulated bars" is switched off, see below)
- The video engine thread does not follow this color scheme.
History Mode and Pause
To see spikes in performance better, enable the History Mode with the drop-down box. Pressing the pause key on keyboard will pause and continue the update of the bars. When the history mode is on and pause mode is on, use the page-up and page-down keys to scroll.
The numbers before the lines are the last three digits of the cluster clock
Interpreting GPU Measurement
When analyzing performance, the first thing to notice is whether it is the CPU or GPU that is limiting Ventuz performance.
Unfortunately, the GPU measurement is sometimes incorrect. Especially when the GPU isn't doing much, it might stall in the middle of the measurement, displaying a high GPU utilization while it is actually doing little. Enable the Stall GPU option: this will negatively effect frame-rate, but correctly tell whether CPU or GPU is the bottleneck.
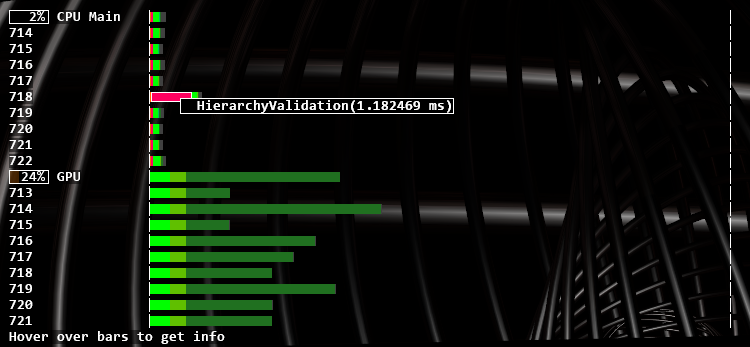
Accumulated Bars Versus Detailed Timeline
By default, the display uses accumulated bars. When this is disabled, the bars show the exact timing as it happens on the CPU or GPU, and not just accumulated values. Also, one can see the various periods where the CPU is possibly waiting for the GPU (blue "idle" bars). In this mode, one can also see how the bars are stacked: ContentValidation and HierarchyValidation are stacked on top of Validation, which shows the total time including what is stacked on top.
Performance Impact of Measurement
Such detailed performance measurement is not for free, and especially the "Stall GPU" option slows things down. When the performance monitor is completely disabled, or the timing section is disabled, no data is recorded and therefore impact to performance is negligible. You can see the difference by switching the timing section ("Performance" in the menu) on and off while keeping the system information on.
More information about how to interpret this below.
System Information
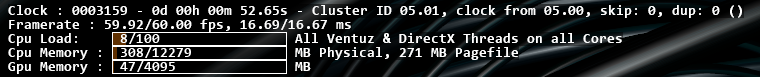
Clock is the internal cluster-synchronized clock of Ventuz. It counts video frames, or fields when in interlaced mode. This line also shows the Cluster clock converted into seconds, minutes, hours and days. Then follows the Cluster ID of this machine, and the Machine ID from which the clock is taken (in a cluster).
The last few numbers count the frames that were skipped or duplicated because of cluster synchronization, and the reason for the last skipping or duplication.
Framerate is the frame-rate and frame duration, accumulated over the last 64 frames (or fields). Again, in interlaced mode this is the rate of full frames with two fields. It shows the actual measured frame-rate and the expected frame-rate. This information is displayed again, converted into milliseconds.
When tweaking performance, think in milliseconds, not fps. You can easily do math in milliseconds, like 3ms + 7ms = 10ms. You can't do that with FPS. 333fps + 143 fps = 100 fps? That's correct, the same numbers as above, but it just doesn't make sense. Also, getting from 40 fps to 50 fps is 5ms, getting from 50 to 60 is 3.3 ms. Squeezing a millisecond is always the same, a difference in fps is essentially meaningless.
CPU Load Tells the total CPU load by the Ventuz process. The Performance Timing bars above only capture the main thread and the video thread. The most important other threads are:
- The DirectX driver usually spawns multiple threads that can not be monitored directly.
- Movie playback creates at least one thread per Movie, and may be many more if the codec supports multi-threading (which it usually does).
CPU Memory shows the percentage of physical memory Ventuz takes up, and how much memory is swapped on disk. The values come directly from the operating system, so they include memory that is allocated indirectly, for instance by DirectX.
GPU Memory shows the percentage of GPU memory Ventuz uses. The values are counted manually by Ventuz whenever it creates or destroys a resource. Since the driver may have some overhead that is not knowable to Ventuz, the actual amount of GPU memory used may be larger.
For instance, the driver may need to round up the width of a texture to the next power of two, so a 640 pixel wide texture gets rounded to 1024, a substantial difference. Ventuz can not know this and reports the incorrect amount.
AV Inputs / Outputs
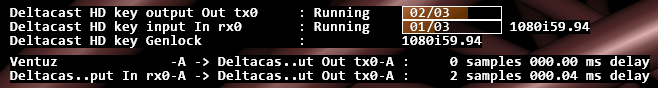
This is a list of all Audio and Video Devices and their states.
The states mean:
- Ready: input stream waiting for a signal
- PreSync: first phase of syncing a stream
- Syncing: stream has found a signal and is synchronizing to that signal
- Disabled: stream is temporarily disabled, but uses up resources and can get running immediately.
- Running: stream is running
- Bypass: stream is in bypass mode because of hardware-watchdog
- Error : stream is disabled and uses up no resources. Either because the stream failed somehow or the stream was disabled in the Live Video node, or the stream is not needed by the Ventuz scene.
The bar shows how many buffers are allocated and if they are full. This is only shown when Ventuz manually manages buffers, like for SDI streams. For an output stream, the buffers should be as full as possible, and when Ventuz is too slow the buffers are drained, a drop is only visible when the queue gets empty. For input streams, the buffers should be as empty as possible, when Ventuz is too slow the queue fills up so that Ventuz can process the images later on. Input frames are only dropped if the queue overflows.
Next is a list of audio cross-points. It shows the amount of delay that is associated with the cross-point. Delay is needed for windows audio devices or asynchronous inputs.
Movies

For each enabled movie related node, this shows information about the movie. This is especially important since most of the CPU load done by movies is not captured in the performance timing bars.
For each movie, the state, position, lead, buffering and file-name is shown.
The states are:
- error: the stream failed
- busy: Internal operation
- empty: No file was loaded
- loadmeta: loading metadata
- loadinfo: prepare playback
- active: normal playback
- pause: playback is paused
- seek: seeking
- waitstream: for Movie Stream nodes, waiting for a stream to receive
When multiple scenes are load into Ventuz, all the inactive scenes have still their audio player initalized. This may waste lots of GPU and CPU memory for the frame-buffers. Movies from inactive scenes have gray text instead of white. Ventuz will automatically take care to put movie clips from inactive scenes into pause mode, so that at least no effort is wasted in decoding frames that are never displayed.
The lead works like this: When the clip is not in async mode, and Ventuz runs in a cluster, it can happen that seeking to a position is not good enough because when the seek is complete, time has passed and the video is already too late. To avoid this problem, always pause the video, seek, wait a bit and then un-pause. If this is not done, Ventuz will notice the problem and automatically seek to a position slightly in the future, like when shooting skeet. A lead of 0 means no problem, 1 means that Ventuz considers leading but hasn't done it already, and higher numbers indicate increasing amounts of lead-time.
The buffers show how many buffers Ventuz has allocated and how many frames in the future are available. If these buffers run dry, increase the number of buffers for that movie.
In the Ventuz Designer, one can jump directly to a movie node by right-clicking on the name of a movie. A message is displayed to hint this:

Here the top movie is in an inactive scene (therefore it is displayed in gray, by right-clicking on it one can see where the node is hidden.
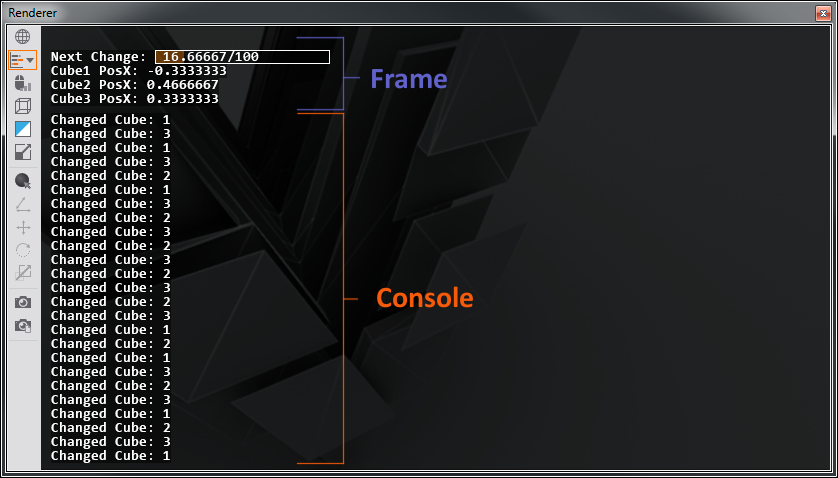
Logging
The performance monitor allows high performance logging. This is divided in two sections: Frame logging is replaced every frame, and can be used for watching values as they changed. This will look like the other performance statistics.
The console will work like a normal log file where messages printed will scroll endlessly.
This is useful to capture events and state changes.
Use the Log Node or scripts to do frame and console logging.
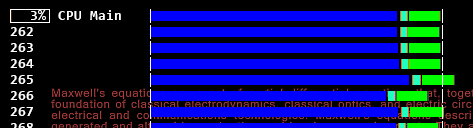
Markup in Logging
The strings [sb:10/100], [mb:10/100], [lb:10/100] will paint a small, medium or long bar which will be filled for 10 of 100 parts (10 %). This bar looks like the Memory bars in the System Information section. The numbers will be printed as written, and the bar-length will be calculated by the division. So 33/100 will yield approximately the same bar-length as 1/3, but display different numbers.
The text-color can be changed with [tc:rgb] and [tc:rrggbb], where r, g and b must be replaced by web-style hex-colors. [tc:ff0000] would be red.
When logging, c# will convert \n to linefeed (ASCII 10) and \f to formfeed (ASCII 12). Linefeeds will work normally, no \r carriage return (ASCII 13) is needed. Formfeeds will insert a half-sized linefeed. This is used between the sections of the performance statistics.
The codes \\, \[ and \] are parsed by the logging system and can be used for escaping. Other uses of the backslash will print the backslash normally. So in a c# script, one can write \\[ to escape a [.
Logging Limits
When using resolutions larger than HD, it becomes noticeable that the console logging area is limited to 238 x 96 characters. Frame logging is limited to 8095 characters total.
Performance Measurement via Script
Logging
For frame-logging use Ventuz.Kernel.Tools.PerfMon.PrintFrame . This information will be overwritten every frame.
For console-style logging use Ventuz.Kernel.Tools.PerfMon.PrintConsole.
All this logging is high-performance and when the performance monitor is disabled, the only cost of this is the formatting of the string.
Performance Timing
This explains how to add custom colored-bars to the performance timing.
First, a token must be created as a static member:
public static Ventuz.Kernel.Tools.PerfMon.Token Script1 =
    new Ventuz.Kernel.Tools.PerfMon.Token("Script1", 0xff8000);
The token has a name and a color. The color is given as hex web-color in RRGGBB format.
To measure something, use the token:
using(Script1.MeasureCpu)
{
    System.Threading.Thread.Sleep(3);
}
Example
Here is a complete example:
using System;
using Ventuz.Kernel;
using Ventuz.Kernel.Tools;


public class Script : ScriptBase, System.IDisposable
{
    private bool changed;

    public Script()
    {
    }

    public virtual void Dispose()
    {
    }

    // Token for Performance Timing

    public static PerfMon.Token Script1 =
        new PerfMon.Token("Script1", 0xff8000);

    public override void Validate()
    {
        changed = true;

        // Logging that will be overwritten every frame

        PerfMon.PrintFrame("Hello World\n");

        // Logging that will spam the console

        PerfMon.PrintConsole("LogLogLog\n");

        // wait a few milliseconds, and add a bar to timing

        using(Script1.MeasureCpu)
        {
            System.Threading.Thread.Sleep(3);
        }
    }

    public bool OnEnable(int arg)
    {
	Ventuz.Kernel.Tools.PerfMon.ConsoleLogEnabled = true;
	Ventuz.Kernel.Tools.PerfMon.FrameLogEnabled = true;
	return false;
    }

    public bool OnDisable(int arg)
    {
	Ventuz.Kernel.Tools.PerfMon.ConsoleLogEnabled = false;
	Ventuz.Kernel.Tools.PerfMon.FrameLogEnabled = false;
	return false;
    }

    public override bool Generate()
    {
        if (changed)
        {
            changed = false;
            return true;
        }

        return false;
    }
}
To make this example work, add an integer input to the C# script node and connect it to the cluster-clock output of the SystemID node. This will update the script every frame, although the value of cluster-clock is ignored.
Scale To Preview
If working in Designer with RenderSetups of high resolution in Machine or Cluster Preview modes, the Performance Statistics rendering might get very tiny. To scale it up to the preview window size, enable this option.
Interpreting the Performance Timing
The Relation Between Main Thread and CPU Percentage
Assume a computer with a 4 core processor with hyper-threading. That makes 8 logical threads.
If a Ventuz scene takes 60% on the Main Thread, and no other time-consuming tasks are done (movie replay, heavy load on the DirectX driver), the CPU percentage should show ca. 7%, as the CPU is able to run 8 threads at the same time, and one of these threads is at 60% load.
Now, hyper-threading is not perfect. One can expect a 50% performance boost through hyper-threading at best, making it feel more like a 5-6 core than an 8 core machine. Still the CPU percentage display will consider all threads the same, as the actual performance boost is highly depending on the application.
Monitoring Movie Playback Performance
The movie playback does not show on the Main Thread. But it shows in the following way:
- The CPU percentage includes all video decoding.
- The status of each movie player can be displayed. Check if there are more active movie players than expected, or if movie players are switched on and off unnecessarily.
- Transfering the image from the CPU where it is decoded to the GPU and performing the color space conversion takes some time on the GPU, displayed as dark-green bar in the performance timing.
When playing low frame-rate video (24 or 30 fps) on full frame-rate outputs (50 or 60 fps), the GPU processing is not performed every frame. Turning on the History option for the performance timing reveals this: The GPU processing is done only every second or third frame. Be aware that while the average GPU load may be below 100%, individual frames may spike beyond the 100% mark.
Why is my Audio Delay so big?
In the AV Inputs/Outputs section, the delay of the audio crosspoints is displayed. This delay is inserted automatically by Ventuz to have some buffer when audio devices do not deliver data completely synchronous. Lets consider an example where an audio crosspoint goes from SDI-In to SDI-Out for a refresh rate of 59.94 Hz (Interlaced). The delay will be quite larget. What's going on here?
- Most likely the input is set to "autodetect". So Ventuz must assume the longest possible frame to buffer.
- If the framerates match perfectly, the buffer must hold exactly one frame. If they don't match, the buffer must hold the duration of both input plus output frame to handle worst case scenarios.
- If the input has the same framerate as the output, is genlocked, and set to synchronous, the delay will be either 2 or 0 samples.
- If the framerate is a 1000/1001 timing like 59.94 Hz (drop frame timing), a 2 samples buffer must be inserted because input and output might in a different phase when it comes to audio-frame lengths.
- When using Blackmagic boards, an extra video-frame of audio-delay is inserted. this is because unlike all other supported vendors, the Blackmagic SDK handles audio and video with separate timing.
So for shortest delays:
- don't use autodetect, specify video format manually
- have input and output at the same frame-rate (but may be different resolution)
- genlock input and output and set input to "synchronized"
- If you have the choice, use a timing without drop-frames.
Explanation of the Various Bars
Red(ish): Validation
- Validation : update bindings and nodes
- ContentValidation : content nodes
- HierarchyValidation : hierarchy nodes
- ResourceLoad : Sending resources (Texture, Geometry) from CPU to GPU.
Green(ish): Rendering
- Render : walk the hierarchy nodes and issue DirectX commands.
- RenderSetupBegin : Overhead before rendering can start
- RenderSetupEnd : Overhead after rendering has finished. This includes Warping.
- Glow : Glow node
- BlurTextureSimple : Blur Texture Simple node
- HLSLShader: HLSL Shader node
- TextRendering: Text nodes
- MovieClip : CPU to GPU transfer and color space conversion during movie replay
Blue(ish): Idle
The Idle markers are only shown when Accumulated Bars is switched off.
- Present: wait for next frame.
- PreventD3DQueuing: wait for GPU to prevent the GPU from queuing up multiple frames.
- ResourceLock : wait for GPU to have access to some GPU resource (Texture, Geometry)
- Blit : A CPU stall that can occur in RenderSetupEnd. This is just an artifact of the measurement method.
- HardGpuStall : force synchronization of CPU & GPU when GPU Stall option is enabled.
- BeginVideo : waiting for video at the start of a frame
- EndVideo : waiting for video at the end of a frame
Cyan(ish): Resource Generation
- ResourceGen : A resource gets update, and is none of the below:
- TextureResourceGen : Texture resource update
- TextResourceGen : Text resource update : this happens when text or layout changes
- GeometryResourceGen : Geometry resource update
- XMLResourceGen : XML/XPath/XSLT resource update
- ShaderResourceGen : Shader resource update
Video Process:
- InputHandling : Processing for Inputs, excluding DMA and colorspace conversion
- InputDma : DMA transfer for input streams
- InputColorSpace : Color space conversion for input streams
- OutputHandling : Processing for Outputs, excluding DMA and colorspace conversion
- OutputDma : DMA transfer for output streams
- OutputColorSpace : Color space conversion for output streams
- EndFieldGpuStall : Synchronization between CPU and GPU at the end of a frame
- WaitForFrame : Processing during waiting for frame (for all streams)
- Wait : Idle time during waiting for frame (this time is used by other threads)
- FinishFrame : Processing at the end of a frame (for all streams)
Other
- Runtime (gray) : The Ventuz Runtime. All major processing should have it's own color, this catches smaller tasks that seemed unimportant to measure individually
- no bar (transparent) : When in Accumulated Bars mode, the times do not add up to 100%. These gaps are time spend with other processes or in the user interface. Especially in the designer, a lot of time may be spend in the user interface when there is mouse-movement.
- InputProcessing (gray) : processing of touch events.
- PerfMon (gray) : performance monitor rendering.