How to Create an Excel Driven Bar Chart
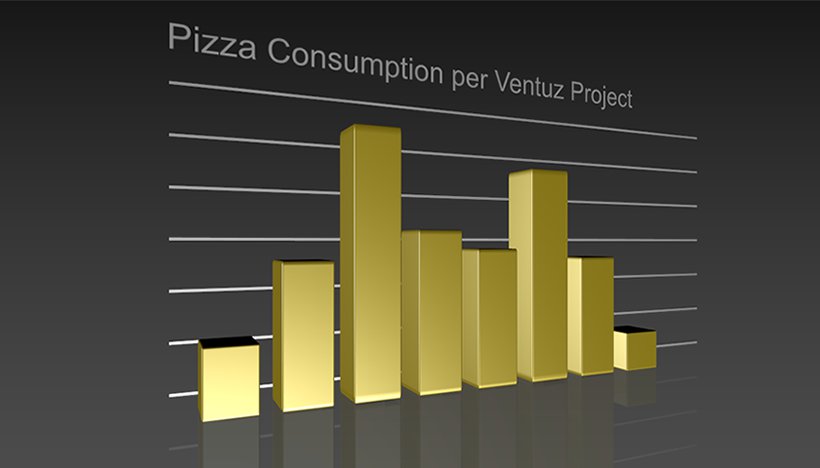
Table of Contents
Introduction
Charts and graphs are an integral part of many presentations. Most presentations, however, being quite static, are limited to pre-generated charts and relatively inflexible constructions. Ventuz, however, can calculate such charts on the fly and give them a high level of visual quality.
This tutorial will guide you through the basic steps of creating a simple Bar Chart that is driven by data received from an Excel file. The second aim of this tutorial is to give you a basic understanding of how to build re-usable content logic systems in Ventuz.
Principle
Obviously, there are several ways to create a bar chart in Ventuz and there is no single ‘correct way’, so see this as a suggestion or inspiration. (if Ventuz were a breakfast cereal, this might be the serving suggestion picture on the box)
Before we can begin, we must break down the task at hand. Thus, in order to create a basic Bar Chart, we need to:
- create the bars
- read the data from an excel file
- process the data a bit so that it is sensible for use in a chart
- connect the scaling and position of the bars to the data
- make it all look good
Step 1: Make a Bar
So, let us start with one bar.
First, we need an Camera Node, which gives us control over the viewing angle and zoom level. Ventuz has three different camera types that will be used with the View Node, in this case an Orbit Camera will do fine, though of course any of the three will work.
Next, we will be dealing with a row of bars, so rather than manually spacing out each bar, we will let Ventuz take care of that. Grab an Arrange Node and place it behind the Camera. In the Arrange Node, set the Alignment property to LeftChain (so it arranges the bars in a row from left to right). Then,  click on the Arrange Node in the Content Editor to show all of the properties and change the X value in ChainOffset to 0.5. This means it will space the bars 0.5 units apart.
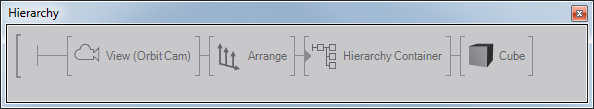
Good, so now we are ready for the first bar. We want all the mechanics for bars to be reusable and as automated as possible. Because of this, we will use Interface Containers that will let us re-use one Container with all the logic for every bar. So, grab a Hierarchy Container Node and place it behind the Arrange Node. Then, get a Cube Node and put it behind the Hierarchy Container, this will be your bar.
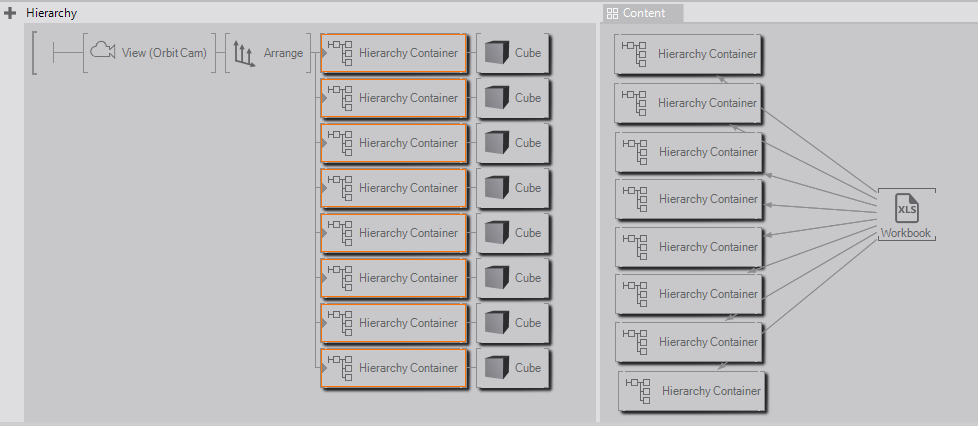
Your Hierarchy Editor should look somewhat like this (remember, select a Node and press F2 to rename it):
Step 2: The Container
So now that we have the bar, we need some automatic logic to control it. This part happens in the Content Editor. Because we do not know how many bars we will have and we want to easily be able to make more, it is best to structure the logic to be as reusable as possible. For that reason we will package it all inside the Hierarchy Container. To enter the Container, double-click the little gray triangle at the left of the Hierarchy Container node. You should now see a blank, empty Content Editor, and an Output Node called Out(1) in the Hierarchy Editor
The idea is that we will 'hide' all of the logic that we will want to reuse for every bar in here, but we will Expose all the important output and input properties so that we can adapt it easily without having to go in and edit the individual nodes.
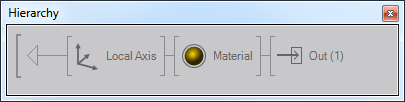
The first thing we need is an Axis Node to position and scale the bar. Get one from the World section of the Toolbox and place it in front of the Output Node. The Output Node symbolizes everything that comes behind the Hierarchy Container outside of the Container, in our case, the Cube. Another thing we might want to control is the color of the bar, so get a Material Node from the Color section of the Toolbox and place it between the Axis and the Output Node (feel free to give it a funky color!). So now we need to do our first Exposing. Select the Material node, and find the Diffuse property, then double-click on the little square to the left of the property. A dialogue box will appear asking you to name the Exposing, which is a good idea, preferrably something you will recognize later.
Your Hierarchy Editor should look something like this now:
Step 3: The Logic
So now it is time to turn towards the actual mechanics.
For the logic, there are a few steps we must accomplish for every bar. We need the value that will determine the height of that bar and then we need to create a control for how high the scaling will be so that we can adapt the height to our presentation. If we simply take the value from Excel and put it on the scaling, what happens if the value is in the hundreds, or thousands, or millions (or millionths)? Basically, we need to be able to scale everything proportionately. One way to do this is simply calculate the bars as percentages of the total, another way is to multiply all bars by a scaling value. Again, there are many different possibilities, depending on the desired result. For this example we will simply implement a scaling factor.
First, grab an Excel Cell (Row,Column) Node ( click on the Excel Workbook Node in the Toolbox). This node will read a specified Excel cell and output the value. We will want all the bars to share the same Excel Workbook, so we should Expose the Workbook property in the Excel Cell Node. Also, it might be useful to be able to set the Column property from outside, so let us Expose that, too.
Also, we need a Variable to control the overall scaling factor. Grab a Float Variable Node and put it in the content editor, then expose its Value property.
With this done, we can start doing some maths, specifically, implement a function to scale the value and a function to adjust the position. First, the scaling. This is best done with an Expression. So, get a Float Expression Node and place it in the Content Editor. We need to give the expression its inputs, so drag the A property from the Expression onto the Excel Cell Node (and select Number from the selection window), and the B property onto our Float Variable. This creates bindings between the two nodes for the given property.
The formula for expression do the following:
Value of the Bar x Scaling Factor
Thus, the exact formula should be:
A*B
The next problem is, Ventuz scales from the middle of an object by default. So either we need to adjust the scaling center, the alignment or the position of the object. While the result would be the same, we want the control of the logic to all be inside the container, so we will just go with another Expression, in this case, calculating one half of the scaling value. So, grab another Float Expression node, bind its A Property to the Output of the first Float Expression, then enter the Expression:
A/2
We can then select the Local Axis Node in the Hierarchy Editor and bind the Y Position Property to the second Float Expression and the Y Scaling to the first.
With this done, we have a system that will read out an value from a specified cell in an Excel table, but would it not be great if Ventuz could automatically increment through the cells, depending on how many bars you add to the scene? Well, to achieve this, we will use a clever trick, the Container Info Node, which can be found in the World section of the Toolbox. This node extracts information about the current container it is in, and one of its outputs is the LinkIndex property, which returns the index position of the container in its current subtree branch. Or, more simply, will count how many objects are at the level of the container and which position it is in. Because this automatically increments as we add more containers, we can use it to increase the Row property of the Excel Cell node. One more thing to bear in mind is that often the rows may not start at the very top. Thus, it would be useful to add an offset. So, simply take an Int Variable and an Int Expression node. Bind the A property of the Expression node to the LinkIndex property of the Container Info node and the B property to the Int Variable. The expression, of course, should then simply be:
A+B
Expose the Value property of the Int Variable so we can change it from outside the container.
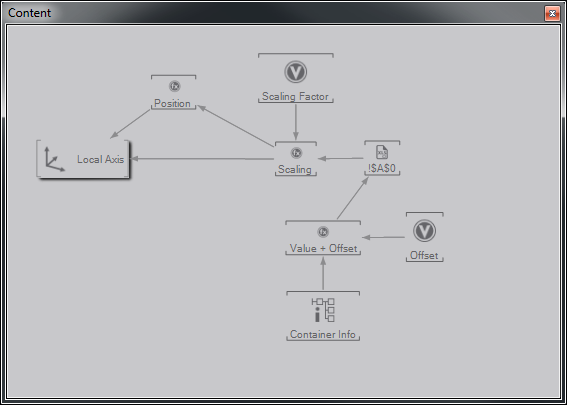
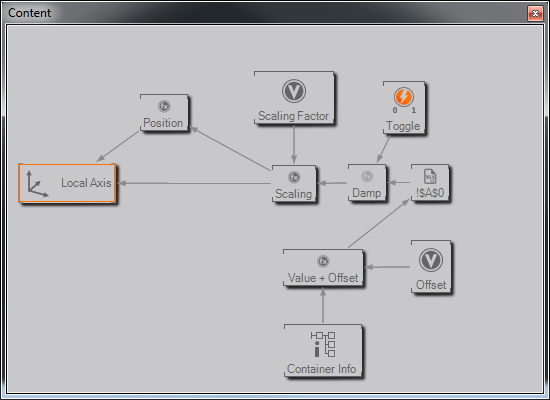
With that, we are done, your Content Editor should look somewhat like this:
Step 4: Connecting the Bars
All that remains is to connect it and try it out, so exit the Hierarchy Container Node (press CTRL + U).
Now, we will be reusing the Hierarchy Container node, so let us be smart about this and make it so we can easily reuse it and change it. To do this, we will make it an Interface Container. Select that Hierarchy Container Node and click on the Interfacing button at the bottom of the Property Editor. Then, if you have a Repository open, drag the node into it, or if not, create a new Repository and then deposit the node in it. Either way, you have now saved your node for future use. Because it is an Interface Container, we can easily change it and then update all instances of it within the scene without having to redo the bindings.
Its Property Editor should look like this:
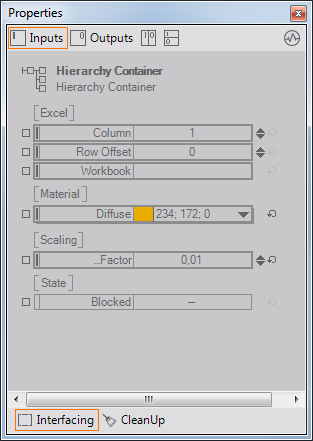
Now, we just need an Excel Sheet with a column of numbers in it. Get yourself an Excel Workbook Node, place it in the Content Editor and bind the Workbook property from the Hierarchy Container node to the Workbook node. Then select an Excel sheet you have with some numbers in it in the properties of the Workbook node.
Now, chances are, you will need to make some adjustments to the settings. You will need to make sure the Row Offset is set to at least 1 (the LinkIndex value of the Container Info node starts at 0). Also, you will need to set the Scaling Factor to an appropriate size. But you can do all this from outside the Content Container, by just click on it and using the exposed properties. .
To now populate a bar chart, just duplicate the Hierarchy Container with all its content and the Cube. The easiest way to do this is to CTRL+ALT+ drag it to the lower edge of the node, so a red triangle appears pointing down, then let go. The reason for the CTRL+ALT combination is that it makes all the copies share the same inputs, so you only have one shared Workbook node. Now you should see two bars in your Render Window, each with a different value. Do this for as many bars as you want or need or have values for.
Now you can go in and clean things up. It helps to rotate the Camera a bit, so the whole chart has a more effective or visually pleasing angle. You can add a reflection, perhaps a background and lighting to quickly add some quality to the scene. Then, your render output should look something like this:

Further Possibilites
There are, of course, plenty more refinements you can get into. Content-wise, for example, you could adjust the scaling factor, add in an automatic value lines or a grid, extract labels or text from the excel file, perhaps display the actual values with a text node or maybe insert a key. But all of these ‘extras’ are simply extensions of what you have already done. Remember also that the objects are bars simply because you have cubes. If you prefer a different look, just put a different geometry there instead of a cube!
However, there is one last step we can do which would add a good amount of visual appeal with very little effort: we can add a bit of animation.
Step 5: Adding Some Animation
This step will actually achieve two things. It will show how to make some simple but cool animation effects, and it will show you how to change your Interface nodes. So, enter the first Hierarchy Container Node (actually, you can enter any one, just remember which one you are changing). Instead of using an Animation node, we will use a Math Effects Node to produce the animation. So, go to the Logic panel in the Toolbox and drag the Math Effects Stack to your Content Editor, then select the Damper Node. We will want to insert it between the Scaling Expression and the Excel Cell Node, so you need to break the binding between those two. Simply click on the line, then on the connection in the popup window. Now, you can bind the A property of the Expression node to the Damper and the Target2 property of the Damper to the Excel Cell Node (and select number from the popup window.) Now, you will see for that bar, if you click the property !UseTarget2 in the Property Editor for the Damper, the bar will move from zero to the value it is receiving. Let us make that something we can trigger from outside the Container with an Event. Get a Toggle Node from the Toolbox and place it in the Content Editor. Then, bind the !UseTarget2 property of the Damper to it. In order to be able to trigger it from outside, you also need to expose the On, Off, and Toggle properties of the Toggle node.
It should now look like this:
So we have a cool animation, but we want it for all the bars, not just the one. This is where the beauty of Interface Containers comes in. Exit your container (press CTRL + U) and open the Repository where you placed the container earlier. Now drag the Container you just modified on to the Container in the Repository (then press okay in the dialog). This has now replaced the Interface Container in your repository with the updated one. If you now drag the update button in the Repository Toolbar, then select update, it will replace all instances of this Interface Container with the new version, but keep any bindings.
So as a final little goodie, we will add a manual trigger to launch the animation. Select all of the Containers (SHIFT+ click) and get a Windows Key Node from the I/O part of the Toolbox. drag a selection rectangle around all of the Hierarchy Containers in the Content Editor window to select them all. Now you can bind all of their exposed Toggle properties in one single go. Bind them all to the Keyboard node. In the Keyboard node, you will need to select a key to be pressed (select the Key property, then press the key you want to use, perhaps (SPACE). Now click in the Render Window to activate it, and press the key you selected.
Obviously, you can do much more here, too. You can go in and tweak the values for the Damper, or use more complex animations.
Conclusion
In this tutorial, you have learned how to use Interface containers to build an automated bar chart driven by an Excel Sheet. You have seen how to do simple bindings and how to expose properties and why it is useful. Hopefully it has also given you some insight into building logic structures inside Ventuz.