How To Create an RSS Ticker
Table of Contents
This How To will show you how to create a news ticker which is dynamically filled with the content of an online RSS feed.
Introduction
News Ticker or News Crawler are very common elements in the broadcasting world. On a minimum of space, they bring the viewer news updates while leaving most of the screen space dedicated to the program. The challenge in implementing a ticker is that it has to adapt to the available content and manage news items during their lifetime, starting when they enter the screen up to the point where they completely have left it again.
Setup
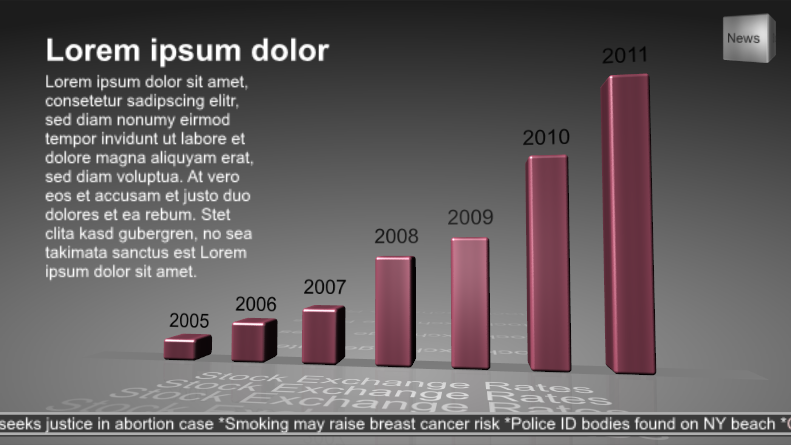
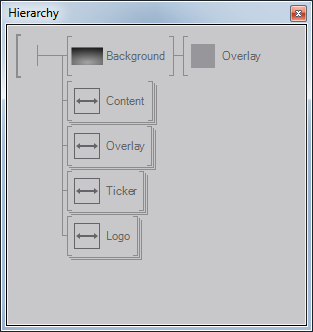
What we are going to create is a very simple news broadcast type scene containing some 2D and 3D content, a news ticker on the bottom and a network station logo in the top right corner. Each part has its own Viewport/Background Node so that we can use independent light and camera setups. So as the first thing, create four Viewport/Background Nodes and name them Content, Overlay, Ticker and Logo. Deactivate the Clear Color flag so that each viewport paints over the result of the previous one.
Above them all, add an Image Loader followed by an Overlay Rectangle to create a background (you can for example use a simple gradient as done here).
Content & Overlay
The 3D Content in the example above is just a collection of beveled Cubes and some Text. A Camera Node has been used to get a nice viewing angle on the diagram which could optionally be animated. A few minor tweaks have been applied to improve the visual quality:
- A Texture Generator has been used to create the brushed metal look of the cubes. The trick is to manipulate the 2D Mapping used to render the texture and stretch it very long using the scaling factors.
- A weak reflection has been added to the ground. This could be done with the techniques presented in the Mirror Reflection How To but since the reflection is so weak, a simpler technique was used. Put all elements that should be part of the reflection into a Group. Add an Axis with a Y-scaling of minus one and then create a reference copy (press CTRL + SHIFT during drag & drop
 ) of the group behind the axis. Finally, insert a Render Options Node between the axis and the referenced group to change the culling behavior to None. This is required as negative scaling changes the order of the triangles (i.e. front facing triangles become back-facing and vice versa).
- Both a Directional Light and a Spot Light have been used. Using multiple light sources usually creates a more interesting shading on the object surfaces.
The text overlay is done using a separate viewport so it is independent of the 3D content. This is just standard text nodes, nothing special here.
Logo
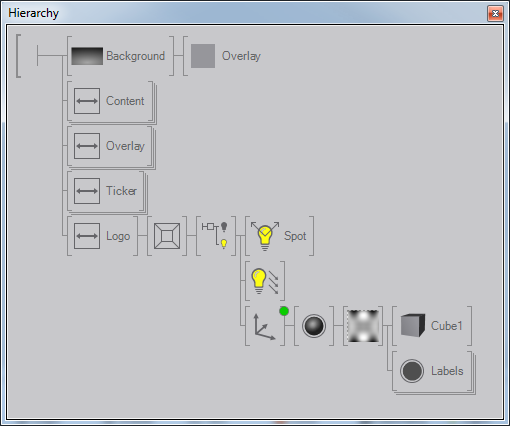
The logo is a simple spinning cube. What is important about the logo is that it lives in its own 3D space. A Perspective Node has been added to use a projection different from the main area. In particular, note that the center of projection lies in the center of the cube and not the center of the screen.
In a similar fashion, the light setup of the logo is different from the rest of the scene. A Light Group has been added with its Inherit flag deactivated. This way all light sources defined outside the logo hierarchy subtree will not affect the logo.
Ticker Geometry
The ticker part of the scene consist of an axis to position the ticker at the bottom of the screen, background geometry and the Ticker node itself.
The background is mainly a Rectangle with a dark grey color that has been resized to fill the complete length of the screen. Behind that main rectangle, another one which is slightly larger and has a brighter color is put to act as an outline around the rectangle. Finally, the rectangle is duplicated, moved down a few pixels and assigned a dark color to function as a simple drop shadow.
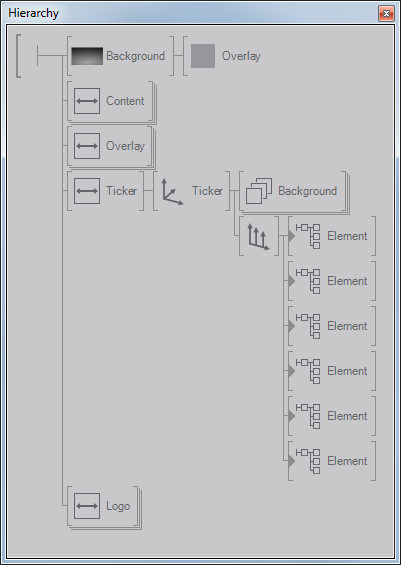
On top of it all sits an Arrange Node with some children, the latter of which we will ignore for now. This part of the scene is what the majority of this How To will focus on.
The Ticker
At the center of the ticker functionality are two nodes: An Arrange Node and a Ticker Node. The Arrange Node is added to the Hierarchy of the scene at the position where the ticker should be rendered in the rendering order. Most of its properties can be ignored for this How To, but the Control property needs to be bound to a Ticker Node. This has the Ticker take control over the Arrange node and use it to present its content.
For the Ticker Node itself, the Width needs to be set to the width the ticker items should be seen on. Since we already have created the ticker background, we can simply check the width of the background rectangles and use the same width for the Ticker. Note however that the Ticker starts in the origin and extends its Width to the right, therefore we either need to align it with an additional axis or construct the background left aligned and then move everything with an axis (what is what we have done here).
New items will appear in their full length to the right of the area specified with Width and will be removed once their entire bounding box has cleared the left end of that area. If the Ticker does not stretch along the complete width of the screen, this will result in items popping in and disappearing while the user can still see them. In such a case, use a Stencil Test to clip the ticker items with the active area of the ticker.
Data Source
Add an RSS Feed Node to the scene and set its FeedURL to some available RSS feed (for example http://rss.cnn.com/rss/cnn_topstories.rss). If the node is able to connect to the RSS feed, it will provide general information about the feed as well as the contents of one feed item via its output properties. By invoking the Next method, the item properties will be set to the next feed entry.
The plain information from the feed needs to be formatted to something the Ticker can use. Add a Convert To Text Node, bind the RSS's ItemTitle to Value0 and change Format to
<Element Text="{0}">
Finally bind the Ticker's Data property to the formatted output of the Convert to Text node and set Mode to Single.
It is vital to have the DataMode property set to Single or Loop. Otherwise you may or may not see items traveling through the ticker but the Ticker will not update their content.
What remains is to tell the RSS node when to switch to the next item. For one, bind the Next method to the Ticker's Underrun property. A Ticker has an internal queue that is added to whenever the value of the Data property changes. When it is time to present a new item, it will be taken from the internal queue.
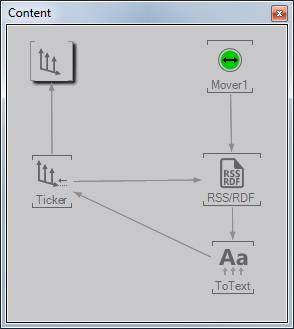
Whenever the Ticker runs out of content, the Underrun event is fired and the RSS feed will switch to the next item. To initially get this started, also add a Mover to the scene, set its duration to something like 10 secs and bind its OnRepeat output event to the Next method of the Ticker. The actual duration for the Mover is not so important as long as it does not flood te Ticker's internal queue. Check the Ticker's QueuedItems property and make sure that it does not go through the roof (remember to have Monitor Values activated to see up to date values).
Ticker Items
We're getting close, but we're still not seeing any result on the screen. The Ticker needs some vessel that can be used to bring the information to the screen. Add a Hierarchy Container behind the Ticker's Arrange node and call it Element. Inside, add a Text 2D with a Block Text and expose its Text property. While we're at it, make sure the Block Text's TextAlignment is set to Center so it nicely fits to the Ticker background we have created.
There are two important aspects of the above step. For one, there is the name of the container which matches the tag name in the Convert to Text node above. This of course is on purpose. Formatting the Data input as
<Element Text="{0}">
will have the Ticker look for a node with the name Element as a direct child of itself. It will then check for a property on that node with the name Text and if available set it to the value after the equations sign (i.e. our news item).
Create multiple copies of the container and add them to the Ticker's list of children. When the Ticker wants to present a new item, it checks its children for any node that matches the tag name and is not yet in use. Once an item leaves the active area of the Ticker, the node is available for reuse. We therefore need to add at least as many copies of the "Element" as there can be items on the screen at the same time.
Extended Functionality
The mechanism of using XML and container properties to separate data management and representation in a Ticker of course offers great flexibility. There are many features that have not been mentioned here but can be found in the Ticker Documentation.
As one example of extended Ticker functionality, we will make each ticker item flash red when it enters the screen. To achieve this, delete all elements except one and then go inside it. Add a Mover, a HSVA to Color and a Color node. Bind the Color's input to the HSVA node and the V-component of the HSVA node to the Mover. Change the Mover to OneShot going from min 100 to max 50 with swing active. Whenever the Nudge method is triggered, the color will change from white to red and back again.
Now comes the interesting part: How to make the Ticker trigger this? The solution is to expose the Nudge method by right-clicking on it and choosing Expose. Most importantly, change the name of the exposed property to TickerIn in the Edit Interface Attributes. If the Ticker find's a method of that name on a child node, it will trigger it automatically whenever the node is reused and inserted into the Ticker area.
Conclusion
When it comes to Ventuz's capability for processing information from a wide variety of sources, the Ticker node is just one way that shows how powerful Ventuz is at dealing with dynamic data. Unfortunately, it is also one of the most complex nodes and the interested reader is advised to carefully read the documentation on both the Arrange Node and the Ticker and Layout Nodes. There are many aspects of the Ticker node that cannot be discovered by trial and error but one simply "has to know". But by following this How To, you should have a great starting point for building more and more complex scenes.