Table of Contents
Video Scopes
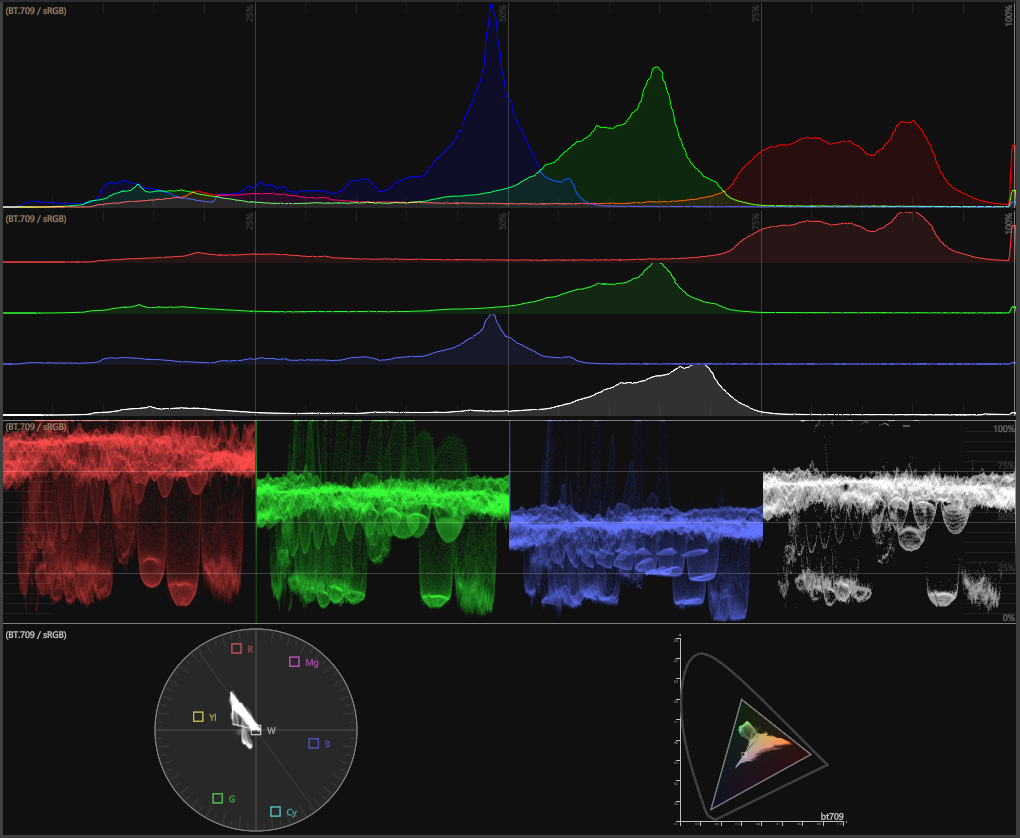
Video Scopes are great to accurately color grade your scene, to check, if its in specific color space boundaries or to inspect an incoming video signal. These tools won't lie to you like your eyes and monitors might. They provide exact representations of what elements make up your image, from color values to brightness. The scopes always apply to what's visible in the Render Window , and are only available if the preview window is set to a single composition/screen/input/output. In the Design Preview and All Outputs mode the scopes are not available. The color space of the scopes is the same as the selected preview.
To activate the Video Scopes use this button:

Next to the button, with the small dropdown arrow, the different scopes can be activated and configured.
Histogram
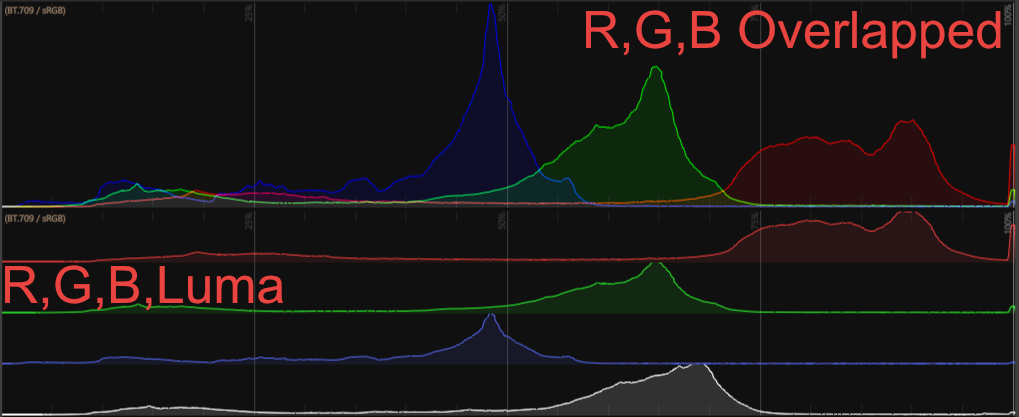
The horizontal axis represents the tonal range from lowest to brightest value with the amount of pixel on the vertical axis.
The Histogram comes with two options as shown in the picture above: R,G,B overlapped, overlaps the color values in one graph showing how much of each brightness is in the image. R,G,B Luma shows each color in a separate graph with the addition of a luma channel as segment.
Waveform
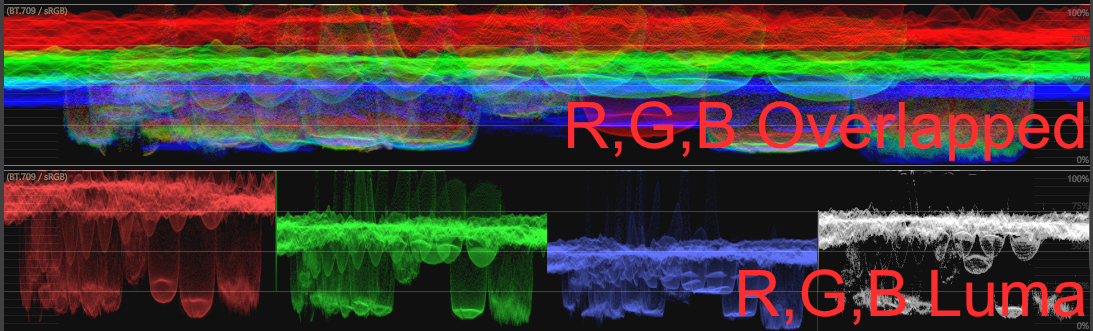
The waveform monitor draws each column of the image (x-axis) on the x-axis of the waveform. The brightness value is represented by the y-axis. The pixel for each column are drawn over each other, so the brightness on the waveform gives information about how many pixel have the same level. Depending on the color space, the color value (y-axis) is displayed in nits (for linear color spaces) or percentage (SDR).
It has the same two modes as the Histogram, R,G,B Overlapped and R,G,B Luma. And also an adjustable brightness slider, which increases the brightness of the drawn pixel, so areas with few pixel are easier to investigate.
Vectorscope
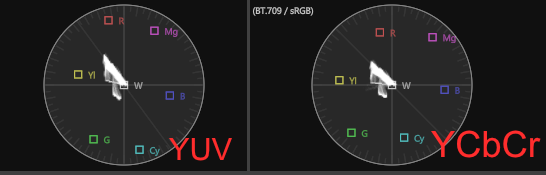
A vectorscope provides more information about the color properties of a video image. A vectorscope contains markings that indicate the degree of hue and saturation in an image. The further the markings are from the center, the more saturation you have in your image.
The vectorscope has two different modes, one displaying it in YUV (the most common way) and YCbCr which is how the signal will actually look. Most commonly used for testing of SDI signals and color grading. The RGB color space is converted to a !YUC/YCbCr color space.
Zoom scales on the saturation axis (the radial axis from the center), to better check a narrow color foot print. The Brightness slider increases the brightness of the drawn pixel, to better see colors with few pixel.
CIE Chromaticity

The CIE Chromaticity show the pixel color values of the frame, regardless of brightness. The drawn boundaries represent the color gamut of the preview renderer's color space. Note: This color space is dependent on the selected preview and the project color space or physical output.
Additionally it is possible to add another graph for comparison via the CIE auxiliary gamut menu and to adjust the brightness.