Navigation

Ventuz Introduction

  • Introduction
  • Getting Started
  • Ventuz Editions
  • Ventuz Products
  • Realtime Rendering
  • Frequently Asked Questions
  • Common Mistakes
  • Deploying a Ventuz Presentation
  • Scene Performance and Tweaks

Quick Guides

  • Quick Guide Index
  • Business Logic
  • 3D Art
  • 2D Art
  • Programming
  • System Engineer

General

  • Index
  • What's New
  • Ventuz System Requirements
  • Configuration Editor
  • Device Configuration
  • Machine Configuration
  • Render Setup Editor
  • Introduction to Compositions, Screens and Outputs
  • Explanation of Compositions, Screens and Outputs
  • Live Runtime Control
  • Project and Show Management
  • Web Configuration Editor
  • Communication Protocol Overview
  • GPI Configuration for Runtime or Director
  • Introduction to the Ventuz Video Engine
  • Supported Formats
  • Supported Hardware
  • Color Management and HDR Workflow
  • Multisampling / Anti-Aliasing
  • Input Subsystem
  • Ventuz Proprietary Files
  • Migrating Configs & Content to Ventuz 8
  • Migrating Content to Ventuz 7
  • Migrating Content to Ventuz 6
  • Migrating Content to Ventuz 5
  • Summary Shortcuts
  • Terminology
  • Manual Index

Ventuz Designer

  • Designer Indices
Introduction
  • Designer Introduction Index
  • Designer Overview
  • Realtime Rendering
  • Project Browser
  • Designer Interface
  • Designer Options
  • Working with Nodes
  • Hierarchy and Content Editors
  • 2D Workflow
  • 3D Workflow
  • PBR Workflow
  • Animation Workflow
  • Best Practices
  • Reading Data in Ventuz
  • Display Images and Movies
  • Scene Performance and Tweaks
  • Deploying a Ventuz Presentation
  • Render to Disk
  • Multi Screen and Output Setup
  • Explanation of Compositions, Screens and Outputs
  • Workflow of using Multi Screens
  • Multi GPU
  • Previs
User Interface
  • Designer User Interface Index
  • Designer Interface
  • Renderer Window
  • Layer Editor
  • Property Editor
  • Property Groups
  • Hierarchy Editor
  • Content Editor
  • Find and Replace
  • Toolbox
  • Animation Editor
  • Shader Editor
  • Text Editor
  • Message View
  • Scene Tree
  • Stage Editor
  • Container Outline
  • Watches Editor
  • Scene Control Window
  • Performance Statistics
2D Workflow
  • 2D Workflow Index
  • 2D Workflow
  • Layer Editor
  • Common Layer Properties
  • IPP Effects
  • Color Correction FX
  • Distortion FX
  • Filter FX
  • Hierarchy and Content Editors
  • Display Images and Movies
3D Workflow
  • 3D Workflow Index
  • 3D Workflow
  • Hierarchy and Content Editors
  • Renderer Window
  • Camera Navigation
  • Manipulate Objects with Gizmos
  • In-Scene Editing
  • Layer Editor
  • Property Editor
  • Hierarchy Editor
  • Working with Nodes
  • Isolated Objects
  • Containers
  • Text Rendering
  • Character Sets
  • Geometry Import
  • Color Management and HDR Workflow
  • Display Images and Movies
  • Particle System
  • Creating Realistic Reflections
  • Unreal Integration
  • Notch Integration
  • E2E Node Overview
Logic Workflow
  • Logic Workflow Index
  • Hierarchy and Content Editors
  • Content Editor
  • Hierarchy Editor
  • Working with Nodes
  • Property Editor
  • Containers
  • Project and Scene Data
  • Reading Data in Ventuz
  • Display Images and Movies
  • Input Subsystem
  • Multitouch
  • TUIO Protocol
  • Open Sound Control
  • Unreal Integration
  • Notch Integration
  • E2E Node Overview
Animation Workflow
  • Animation Workflow Index
  • Animation Workflow
  • Animation Editor
  • Content Editor
  • Hierarchy Editor
  • Property Editor
  • Animation and State Engine
  • Templates
  • Template Engine
  • Scene Transitions
  • Unreal Integration
  • Notch Integration
Project Structure
  • Project Structure Index
  • Annotations
  • Project Documentation
  • Projects and Scenes
  • Project Properties
  • Project Maintenance
  • Project and Scene Data
  • Scene Management
  • Scene Statistics
  • Scene Tree
  • Performance Statistics
How Tos
  • Designer How to Index
  • How to Run Ventuz
  • How to Work with Designer
  • Ventuz Designer Drag&Drop Workflow
  • How to work with Shadows
  • How to Build Content for Multiple Screens
  • How to Use Emoijs
  • How to Build a Template
  • How To Build a Custom Scene Transition
  • How to Use the Color Difference Keyer
  • How To Enable HDR Video Output
  • How To Work with the HDR Layer
  • How Create Lens Flares and Bloom
  • How to Create Visuals Loader Node
  • How to Remote Control with a Phone
  • How to use Head Mounted Displays
  • How to work with 3D Reference Layers
  • How to create a Firework Particle System
  • How to use DDS with new Block Compression modes
  • How To use Stream Out
  • How to use the Substance Integration
  • How To Integrate Unreal
  • How To Integrate Notch
  • How To use the Vertex Integration
  • How To Control and Customize Ventuz
  • How to use the Companion with Director
  • How to build Previs scenes with Designer
  • How to migrate from Ventuz 6 to Ventuz 7
Reference
  • Available Nodes
  • Animation Nodes
  • Material&Color Nodes
  • Data Nodes
  • E2E Nodes
  • Geometry Nodes
  • Interaction Nodes
  • IO Nodes
  • Layers
  • Light Nodes
  • Logic Nodes
  • Previs Nodes
  • Render Option Nodes
  • Slides Nodes
  • Sound Nodes
  • Text Nodes
  • Texture Nodes
  • VR Nodes
  • World Nodes
  • Summary Shortcuts
  • Layer Editor Shortcuts
  • Hierarchy Editor Shortcuts
  • Content Editor Shortcuts
  • Animation Editor Shortcuts
  • Director Shortcuts

Ventuz Director

  • Index
  • What's New in Director
  • Introduction
  • Environment
  • Show
  • User Interface
  • Assets
  • Taking Action
  • Property Editor
  • Shot Box
  • Project Data
  • Pages
  • Playlist
  • Transitions
  • Timeline
  • Content References
  • Topology
  • Channels
  • Macros
  • Designing Templates
  • Scene Transitions
  • Plug-Ins
  • Shortcuts
  • Command Line Options
  • Application Settings
  • Glossary
  • GPI Configuration

Ventuz Runtime & Configuration

  • Runtime Index
  • Configuration Editor
  • Machine Configuration
  • Device Configuration
  • Project and Show Management
  • Live Runtime Control
  • Web Configuration Editor
  • Render Setup Editor
  • Warping and Soft-Edging Editor
  • Multi Screen and Output Setup
  • How to migrate from Ventuz 6 to Ventuz 7
  • Machine Clustering
  • Supported Hardware
  • Director Mode
  • How to Configure Audio
  • How to Use Live Options
  • How To Play Out On Multiple Screens
  • How To Render on a Machine Cluster
  • How to Use Head Mounted Displays
  • How to Setup Spout with Ventuz
  • How to Use Newtek NDI
  • How to Use a Mixed Frame Rate Cluster
  • How to Use Tracking

Multi Output & Display Setups

Introduction
  • Introduction to Compositions, Screens and Outputs
  • Explanation of Compositions, Screens and Outputs
  • Machine Clustering
  • Support for multiple GPU's
Editors
  • Configuration Editor
  • Device Configuration
  • Render Setup Editor
  • Warping and Soft-Edging Editor
  • Designer Stage Editor
Workflows
  • How to Build Content for Multiple Screens
  • How To Play Out On Multiple Outputs
  • How To Render on a Machine Cluster
  • How to build Previs scenes with Designer

How To

Designer
  • Designer How to Index
  • How to Run Ventuz
  • How to Work with Designer
  • Ventuz Designer Drag&Drop Workflow
  • How to work with Shadows
  • How to Build Content for Multiple Screens
  • How to Use Emoijs
  • How to Build a Template
  • How To Build a Custom Scene Transition
  • How to Use the Color Difference Keyer
  • How To Work with the HDR Layer
  • How To Enable HDR video output
  • How Create Lens Flares and Bloom
  • How to Create Visuals Loader Node
  • How to Remote Control with a Phone
  • How to use Head Mounted Displays
  • How to work with 3D Reference Layers
  • How to create a Firework Particle System
  • How to use DDS with new Block Compression modes
  • How to use the Substance Integration
  • How To Integrate Unreal
  • How To Integrate Notch
  • How To build and playback Ventuz Content in Vertex
Runtime & Configuration
  • Runtime How Tos Index
  • How to Configure Audio
  • How to Use Live Options
  • How To Play Out On Multiple Screens
  • How To Render on a Machine Cluster
  • How to use Head Mounted Displays
  • How to setup Spout with Ventuz
  • How to use Newtek NDI
  • How to use a Mixed Frame Rate Cluster
  • How to use Tracking
  • How To Integrate Unreal
  • How To Integrate Notch
  • How To build and playback Ventuz Content in Vertex
  • Multi Screen and Output Setup
  • How To Enable HDR video output
Director
  • How To Control Multiple Graphics Independently From Each Other
  • How to use the Companion with Director

Ventuz Node Reference

Available Nodes Overview
  • All Designer Nodes
ANIMATION
  • Mover
  • Alternator
  • Simple Control
  • Timeline Control
  • Anmation Rig
  • Keyframe Animation
  • Animation Group
COLOR/MATERIAL
  • Alpha
  • Fog
  • Ground Fog
  • Sky Box
  • Color to RGBA
  • HSLA to Color
  • RGBA to Color
  • Color Transformer
  • HLSL Shader
  • Color
  • Material
  • Color Picker
  • Substance Material
DATA
  • Database
  • Excel
  • JSON
  • RSS Feed
  • Resource Linker
  • Text File
  • XML
E2E
  • E2E Axis
  • E2E Data
  • E2E Control
  • E2E Layer
  • E2E Provider
  • E2E Node Overview
GEOMETRY
  • Rectangle
  • Rounded Rectangle
  • Gradient Rectangle
  • Overlay Rectangle
  • Cube
  • Circle
  • Sphere
  • Cylinder
  • Cone
  • Torus
  • Chart
  • Random Points
  • Mesh Loader
  • Geometry Import (Live)
  • Volume
  • Get Bounding Box
  • Arrow
  • Particle System
  • Path Renderer
  • Geometry Renderer
INTERACTION
  • Interaction Rect
  • Touch Button
  • Touch Excluder
  • Touch Marker
  • Touch Paint
  • Touch Pattern
  • Touch Proxy
  • Touch Ripples
  • Touch Transformations
  • Web Browser
  • Touch Teleport
  • Touch Simulator
INPUT/OUTPUT (I/O)
  • GPI
  • Joystick
  • Keyboard
  • MIDI
  • Mouse
  • Network
  • Open Sound Control
  • Serial
  • Timecode
  • DMX
  • HTTP
  • RamDiskWriter
LAYER
  • 3D Layers
  • 3D Layer Reference
  • Composition Layer
  • 2D Layers
  • PSD Import Layer
  • E2E Layer
  • Mixer Layer
  • Others
LIGHT
  • Light Sources
LOGIC
  • Array Processing
  • Convert To Text
  • Cluster Synchronization
  • Counter
  • Data Portals
  • Date Time
  • Directory
  • Dispatcher
  • Enumeration
  • Expressions
  • Invert
  • Log
  • Loop Breaker
  • Math Effects
  • Matrix Operations
  • Scene Event
  • Script
  • String Operations
  • System ID
  • Render Setup Relation
  • Text Splitter
  • Timer
  • Toggle
  • Transition Info
  • URL
  • Value Switch
  • Value Buffer
  • Variables
  • Visual Indexer
PREVISUALIZATION
  • Introduction to Previs
  • Previs Screen
  • Previs Canvas
  • Compositon List
  • Rendersetup Objects
  • Composition Projector
  • Previs Screen Render Options
RENDER OPTIONS
  • Alpha Blending
  • Color Write
  • Alpha Testing
  • Clip Plane
  • Filter
  • Mask
  • Mirror
  • Effect
  • Render Cube Map
  • Draw Modes
  • Stencil
  • ZTesting
SOUND
  • Audio Clip
  • Sound
  • Volume Control
  • Audio Analysis
SLIDES
  • Slide Manager
  • Slide
  • Slide Port
  • Pivot
TEXT
  • Text Effects
  • Text Layouts
  • Text Rendering
TEXTURE
  • Background
  • Hatch
  • Image
  • Texture
  • SVG Loader
  • Gradient Texture
  • Live Video
  • Movie Stream
  • Movie Frame
  • Movie Clip
  • Texture Loader
  • Snapshot
  • Snapshot Framebuffer
  • Texture Saver
  • Video Source Selector
  • VIO Input
  • Spout Receiver
  • NDI Receiver
  • Substance Loader
  • QR Code
VR/AR
  • Tracked Devices
  • Draw Tracked Devices
WORLD
  • Axis
  • Billboard
  • GetWorld
  • SetWorld
  • Arrange
  • Ticker
  • Layout
  • Group
  • World Z Sort
  • YesNo
  • Switch
  • Spread
  • Filter Pass
  • Set Pass
  • Hierarchy Container
  • Scene Port
  • Content Container
  • Template Port
  • Container Info
  • Camera
  • Paths
  • Cloner

Advanced and Development

  • Advanced and Development Index
  • Command Line Options
  • Ventuz IP Ports
  • Ventuz Machine Service
  • TUIO
  • .NET Scripting
  • HLSL Shader Programming
  • Ventuz API and SDK
  • Ventuz Extension API
  • Ventuz VIO API
  • Ventuz File Format (VFF)
  • Ventuz Stream Out API
  • Lens Calibration File for FreeD
  • E2E Node Overview
  • Unreal Integration
  • Notch Integration
Remoting
  • Remoting Index
  • Remoting Overview
  • How To Control and Customize Ventuz
  • Remoting 4
  • Remoting 4 via Websockets
  • Remoting 4 via HTTP
  • Director Remoting
  • Deprecated Remoting

Misc

  • Presets
« Previous:
» Index «
Next: »

Chart

Area Chart An area chart geometry automatically generated based on the Values input property.
Line Chart A line chart geometry automatically generated based on the Values input property.

Area Chart

Based on an array of numeric values, the chart nodes create a 3D geometry which dynamically changes as the values are changed. This makes Ventuz ideally suited for dynamic business presentations or election news reports. The author of the scene designs the look and feel in advance, but the actual values can come from an up-to-date, external source.

The ValuesAreXYPairs defines if the input array contains only Y values or XY value pairs in the format (X0, Y0, X1, Y1, X2, Y2,...). Note that in case of XY value pairs the X values have to be ascending. The value pairs are only taken into account until an X value is detected that is smaller or equal than its predecessor - in other words: the Chart nodes do not sort XY pairs by its X component! When a following X value is lower than one before, the graph will not render any subsequent points.

It is also important to understand that the SizeX property behaves differently in case of XY value pairs. If the input array contains only Y values, they are distributed evenly in an X range from 0 to 1. SizeX then just scales the resulting geometry but the underlying math just operates in 0 <= X <= 1; This becomes obvious by the LastValueX value which in this case always stays 1. If the input array provides XY values pairs then of course the X values come from the input array and are not limited to a certain range. In this case the SizeX property acts as a maximal geometry extend in positive and negative X direction. This means that e.g. in case of SizeX = 20 the chart geometry will never exceed the X position [-20, 20], even though the input X components can be larger. The resulting geometry is just scaled down in X to fit inside this limit. This distinction between Y only and XY value pairs is also important when it comes to the EvaluationX input property. The Chart nodes calculate the corresponding Y values (Evaluation output properties) for an input X. In case of Y only inputs the EvaluationX is only valid in the range [0, 1]; in case of XY value pairs the valid X range is not limited. The evaluated value is always the incoming X value of the value pair. So if the geometry is scaled down with the SizeX property, the evaluation is still done with the incoming X value and not the Position X value!

The Size values in X and Z define the dimensions of the chart geometry in their respective directions. ScaleY is a scaling factor for the Y input values which actually populate the chart.

What makes the chart geometries particularly interesting are the Visibility Properties. The X property can be used to restrict the horizontal region that is rendered. By animating this value, the chart can dynamically grow as time goes by. By default, a point is rendered for every value in the input array. The Y property specifies if All or only Positive or Negative chart segments should be displayed. By deactivating ShowZeros, no chart segment is rendered for consecutive zero values. This all can be used to achieve some nice effects by using two graphs, one for positive and one for negative values and placing the nodes underneath each other and providing them with the same input values. This way the graph can have a different material whether it is positive or negative.

The StopFlag is a custom value that when encountered in the input array will prevent the graph from rendering any subsequent values. For example, if the stop value is 1111, the input array contains 10 values and the third value is 1111, only the first two values are visualized. This is handy when using values coming from an external data source. For example, some stock exchange rate software might send its values to Ventuz and put it into a comma separated string. This string can be bound to the input values property and the chart will automatically extract the individual numeric values.

Line Chart

Mathematically the LineChart has the same foundation as the AreaChart - only the visual representation of the input values differ. Additionally the LineChart node has two more properties than the AreaChart. These properties define the characteristic of the line geometry. Strength specifies the strength of the line segments. CornerThreshold defines from which angle the corner of two adjacent line segments is beveled.

Outputs

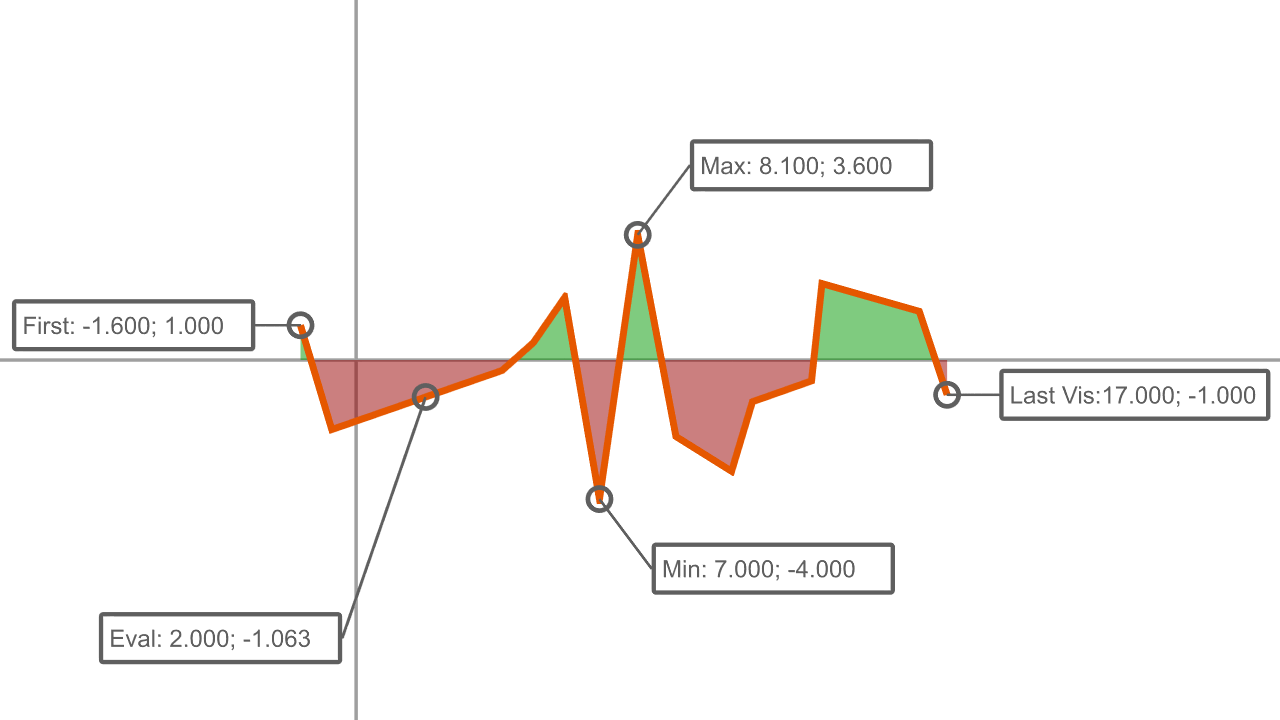
Both Chart nodes have a few output properties that provide some characteristics of the input array and the resulting geometry. The LastValue properties provide the last visible value pair based on the original input values. The LastPos provide the last visible value pair in the local 3D space of the chart geometry. These value are affected by the Size properties. The MinPos properties provide the position of the smallest Y value in the local 3D space of the chart geometry. MaxPos does the same for the largest Y value. The VisibilityXMarker output array provides values which indicate if a key value from the Values input array is visible. 1 means that the according key is visible. 0 indicates that the key is not visible. A value >0 & <1 means that the VisibilityX lies between two key values.

Output Description
VisibilityXMarker array providing values which indicate if a key value from the Values input array is visible: 1 means that the according key is visible; 0 indicates that the key is not visible; a value >0 & <1 means that the VisibilityX lies between two key values.
EvaluationValueX the X value for evaluation of the corresponding Y value (y = f(x))
EvaluationValueY the Y value for the corresponding X value
EvaluationPosX the corresponding X value for the evaluation in the local 3D space of the chart geometry
EvaluationPosY the corresponding Y value for the evaluation in the local 3D space of the chart geometry
FirstValueX the X value of the first key point
FirstValueY the Y value of the first key point
FirstPosX the corresponding X value of the first key point in the local 3D space of the chart geometry
FirstPosY the corresponding Y value of the first key point in the local 3D space of the chart geometry
LastVisibleValueX the X value of the last visible point depending on the VisibilityX property
LastVisibleValueY the Y value of the last visible point depending on the VisibilityX property
LastVisiblePosX the corresponding X value of the last visible point depending on the VisibilityX property in the local 3D space of the chart geometry
LastVisiblePosY the corresponding Y value of the last visible point depending on the VisibilityX property in the local 3D space of the chart geometry
LastValueX the X value of the last key point
LastValueY the Y value of the last key point
LastPosX the corresponding X value of the last key point in the local 3D space of the chart geometry
LastPosY the corresponding Y value of the last key point in the local 3D space of the chart geometry
MinValueX the X value of the key point with smallest Y value
MinValueY the Y value of the key point with smallest Y value
MinPosX the corresponding X value of the key point with smallest Y value in the local 3D space of the chart geometry
MinPosY the corresponding Y value of the key point with smallest Y value in the local 3D space of the chart geometry
MaxValueX the X value of the key point with largest Y value
MaxValueY the Y value of the key point with largest Y value
MaxPosX the corresponding X value of the key point with largest Y value in the local 3D space of the chart geometry
MaxPosY the corresponding Y value of the key point with largest Y value in the local 3D space of the chart geometry

See also:
  • Float Array node
  • Array Processing

« Previous:
» Index «
Next: »
Copyright 2025 Ventuz Technology