Performance Statistics and Diagnostics
Table of Contents
- Statistics Options
- Performance
- System Information
- GPU Basic Statistics
- GPU Advanced Statistics
- Video Phase
- Output Information
- AV Inputs / Outputs
- Movies
- Tracking
- Layer Processing
- User Log
- Watches
- Label Outputs
- Detailed Frame Timing Debug
- Force GPU Stall
- Scale To Preview
- Stats that may slow rendering
- Clear Timing Debug
- Resync Swap Queues
- Logging
- Performance Measurement via Script
- Interpreting the Performance Timing
- Explanation of the Various Bars
 or the Diagnostics tab inside the Configuration editor to analyze performance problems in a scene. The Diagnostics are a bit slimmer in there functionality then the Performance Statistics, but these are also accessible remotely using our Web-based Configuration Editor.
Configuration Editor: 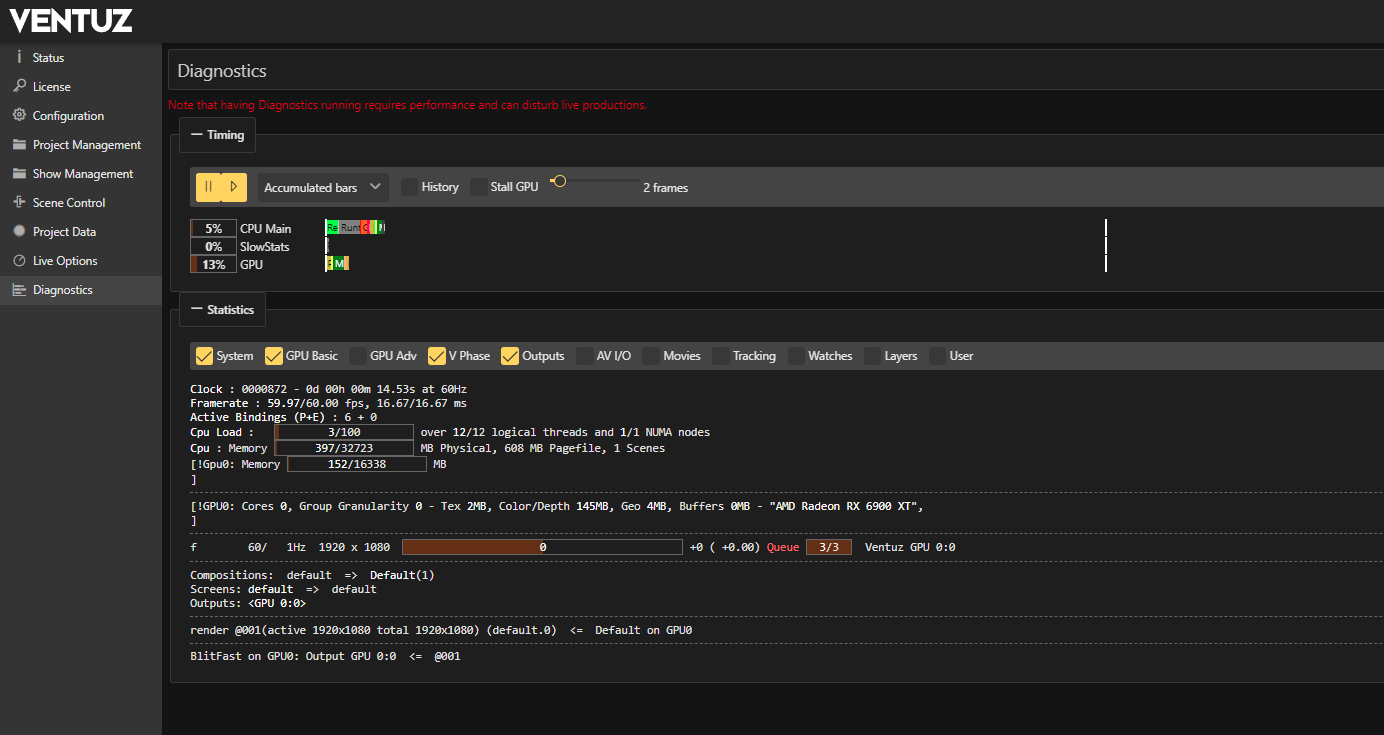
Designer: 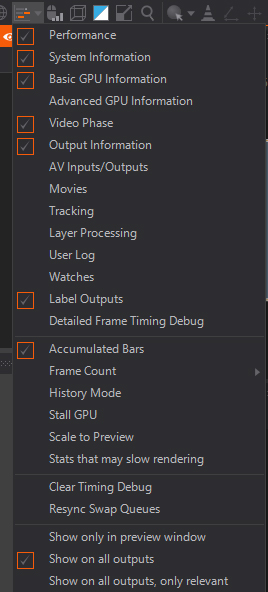
Statistics Options
The performance statistics contain a lot of information. In many cases displaying it all can be a bit overwhelming and requires a lot of screen real-estate. So individual sections can be enabled and disabled and with the Frame Count the amount of visible frames can be adjusted.
The display is updated every frame. By pressing the pause key, the update of all sections can be paused.
Performance
Here is an explanation of these sections.

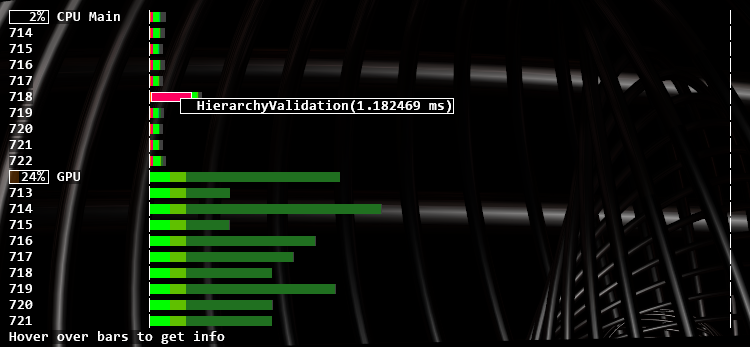
This gives a detailed breakdown of what happens on the main CPU thread and the GPU. If SDI boards or Webcams are in use, it will also display the timing of the Video IO thread.
The percentages are averaged over the last 64 frames. The colored bars show in more detail which part of Ventuz is performing worst. By hovering over the bars, a tool-tip explains what the bars stand for. The vertical white lines represent frames. The display is configured to show two frames, assuming you are most interested in performance when things are bad.
Please note that the performance statistics are about frames, not fields. So when running at 1080i50, expect a framerate of 25Hz, and the bars show information about rendering two fields. This is especially interesting for the video engine, as it does most of its work per frame and not per field.
In general:
- White bars represent the designer user interface. Switch off the monitor buttons in the property and layer view to reduce this.
- Green bars represent rendering (on CPU and GPU)
- Red bars represent validation (on CPU)
- Cyan bars represent resource generators (on CPU mostly)
- Yellow/Orange bars represent layers / post-processing
- Blue bars represent idle time (only displayed when "accumulated bars" is switched off, see below)
- The video engine thread does not follow this color scheme.
By default, bars for two frames are displayed. If the scene runs slower than two frames, the bars are truncated. To display more or less then two frames, the number of frames can be changed with the FrameCount setting in the performance pull-down menu.
System Information
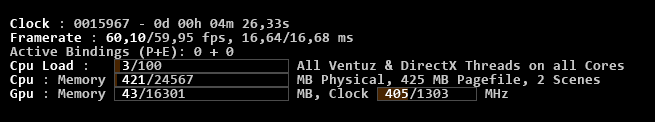
Clock is the internal cluster-synchronized clock of Ventuz. It counts video frames, or fields when in interlaced mode. This line also shows the Cluster clock converted into seconds, minutes, hours and days. Then follows the Cluster ID of this machine, and the Machine ID from which the clock is taken (in a cluster).
The last few numbers count the frames that were skipped or duplicated because of cluster synchronization, and the reason for the last skipping or duplication.
Framerate is the frame-rate and frame duration, accumulated over the last 64 frames (or fields). Again, in interlaced mode this is the rate of full frames with two fields. It shows the actual measured frame-rate and the expected frame-rate. This information is displayed again, converted into milliseconds.
When tweaking performance, think in milliseconds, not fps. You can easily do math in milliseconds, like 3ms + 7ms = 10ms. You can't do that with FPS. 333fps + 143 fps = 100 fps? That's correct, the same numbers as above, but it just doesn't make sense. Also, getting from 40 fps to 50 fps is 5ms, getting from 50 to 60 is 3.3 ms. Squeezing a millisecond is always the same, a difference in fps is essentially meaningless.
Active Bindings (P+E) shows the number of validated bindings of each frame. The first number shows property bindings and the second one shows event bindings.
CPU Load Tells the total CPU load by the Ventuz process. The Performance Timing bars above only capture the main thread and the video thread. The most important other threads are:
- The DirectX driver usually spawns multiple threads that can not be monitored directly.
- Movie playback creates at least one thread per Movie, and may be many more if the codec supports multi-threading (which it usually does).
The Scenes count behind the CPU Load simply indicates how many scenes are currently loaded into memory.
CPU Memory shows the percentage of physical memory Ventuz takes up, and how much memory is swapped on disk. The values come directly from the operating system, so they include memory that is allocated indirectly, for instance by DirectX.
GPU Memory shows the percentage of GPU memory Ventuz uses. The values are counted manually by Ventuz whenever it creates or destroys a resource. Since the driver may have some overhead that is not knowable to Ventuz, the actual amount of GPU memory used may be larger.
For instance, the driver may need to round up the width of a texture to the next power of two, so a 640 pixel wide texture gets rounded to 1024, a substantial difference. Ventuz can not know this and reports the incorrect amount. The Clock shows the current core frequency as well as the base frequency.
Note that the GPU Clock field shows the frequency of the core not that of the memory. It can go beyond 100% when overclocking the GPU.
Further information on the GPU can be found as well: The manufacturer as well as the model name, its core number and its core group granularity is diplayed right below the memory usage bars.
GPU: Indices is the number of Vertices drawn ignoring reuse. Each triangle contributes 3 indices, each line only 2. DrawCalls are the number of times something is drawn. With font rendering, multiple draw calls can be combined to a batch. The number of Batches is the most important indicator on how much time is spend in the graphics driver. Another trick used by font rendering to reduce the number of batches is Instancing.
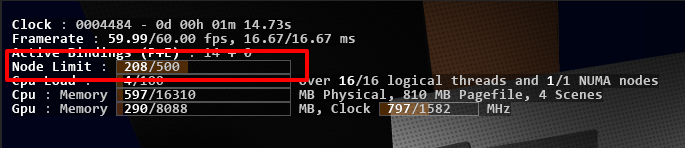
Node Limit
In the Community Edition of Ventuz you will find an additional Node Limit in this list. It indicates the currently rendered Primary Nodes and their maximum allowed number.
GPU Basic Statistics

Cores:Number of shader cores are reported by vendor specific API. This number may be incorrect for some architectures and is only used to give a rough estimate on how powerful a GPU is.
Group Granularity: Number of shader threads that are guaranteed to run in lockstep. Usable for shader optimizations.
Tex: Memory used in textures, excluding color and depth buffers.
Color/Depth: Memory used for rendertargets and depth buffers.
Geo: Memory used for vertices and indices of meshes.
Buffers: Memory used for buffers. Buffers are used for instance in the particle system.
GPU Advanced Statistics
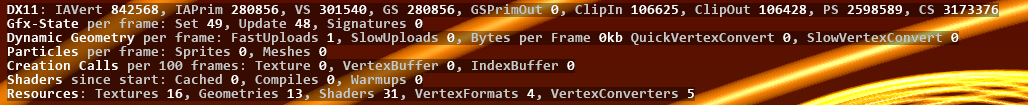 Gfx-State: Each material is represented as a gfx-state when it is actually drawn. Each frame the states are set and possibly need an update. Updating is especially expensive if the shader-signature has changed and the exact shader variant has to be determined. this gets even more expensive if the shader is new and needs to be compiled. You should make sure your Signature values are near 0 and Compiles are always 0.
Dynamic Geometry: Ventuz will do some FastUploads for internal purposes. When a geometry is animated by binding it, this will issue a SlowUpload when a value changes. How slow such an update is depends on how complex the vertex format is: Most vertex formats will undergo no conversion or a QuickVertexConvert. Sometimes a SlowVertexConvert has to be done, this should be avoided on animated geometries.
Particles: Shows how much particles, either as a sprite or mesh, are calculated every frame. High numbers can impact the performance of your scene drastically. Generally speaking meshes are impacting performance more then sprites.
Creation Calls: Are an exceptionally expensive part of the DirectX API and should only happen during scene loading.
Shader: Shows the currently cached and compiled shader number.
Persistent Resources: are resources that accumulate and are never deleted until Ventuz is quit. VertexFormats and VertexConverters are cheap internal resources that should stay below 25. Shaders is the number of different shaders that have been used since Ventuz started.
Video Phase
The Video Phase will give you detailed information about the health of all current outputs.
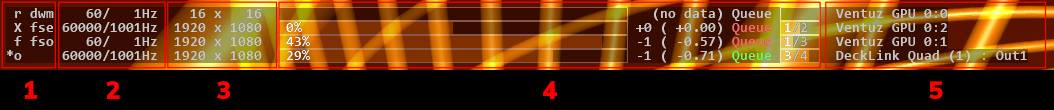
1: The star indicates which output is used as timing ressource for the Ventuz clock. A SDI output has highest priority, followed by a GPU output (except Preview window). Shared Surfaces or NDI has the lowest priority. The Preview Window is only used, if there is no other output.
The first letter code indicates what Ventuz has set:
- 'w' floating window
- 'f' fullscreeen desktop rate
- 'X' fullscreen exclusive
- 's' swap sync
- 'o' SDI / NDI / other (that dont have a window)
- 'r' preview window
Everything after that will show the output mode:
- fse : (medium) full screen exclusive - fullscreen in exclusive mode, changes on the output needs to re-initialize outputs, results in flickering on outputs.
- fso : (good) full screen optimizations - borderless window promoted to fullscreen. We recommend using fso mode; this mode works best with multiple outputs and their synchronization.
- dwm : (bad) display window manager - composition. synchroneity not guaranteed
- blt : (bad) some other path
The following situations will always be "dwm" and should not be considered a problem:
- floating window outputs
- runtime preview window
- designer preview window, unless switched to fullscreen (which will be of the fso kind).
2: Shows the current framerate the Output is using in Hertz.
3: Currently rendered resolution of that output.
4: The orange bar shows the shift of the video phase in percentage compared to the output with 0% shift. The values afterwards represent the shift in whole frames and partial numbers.
Queues are represented in different colors depending on there sync status:
- Green = queue has the optimal number of frames
- Red = Queue is buffering too many or too few frames - there might be a frame offset on the output
- Gray = optimal number of frames not available. This information is only available for fullscreen modes and certain SDI vendors(Deltacast and Blackmagic). For instance it is not available for NDI streams.
Note: For some devices like GPU outs in fullscreen exclusive or specific SDI boards, this indication might not be correct. 5: Output device name and output number / output name
Output Information
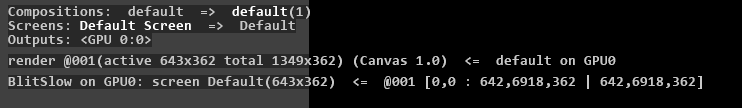
Composition: Shows the currently rendered Composition.
Screens: Currently rendered Screen(s).
Outputs: Used GPU's for the current rendering.
Render: Shows the current number of render steps more complex scenes will show a higher number.
- Active: Shows the currently rendered resolution.
- Total: The size of the renderer window which could be rendered.
These resolution numbers will be bound to your Render Setup when using only the Runtime, previewing the "Design Preview or enabling "Screens and Outputs without Scaling". Only the other previews inside the Designer are dynamically changing it to save performance!
Blitslow/Blitfast:
- Blitfast copies the whole screen 1:1
- Blitslow can cut parts of the source and copies to parts of the destination, potentially with scaling and rotation, therefore slower. Slow does not mean really slow, it just means a bit slower.
AV Inputs / Outputs

This is a list of all Audio and Video Devices and their states.
The states mean:
- Ready: input stream waiting for a signal
- PreSync: first phase of syncing a stream
- Syncing: stream has found a signal and is synchronizing to that signal
- Disabled: stream is temporarily disabled, but uses up resources and can get running immediately.
- Running: stream is running
- Bypass: stream is in bypass mode because of hardware-watchdog
- Error : stream is disabled and uses up no resources. Either because the stream failed somehow or the stream was disabled in the Live Video node, or the stream is not needed by the Ventuz scene.
The bar shows how many buffers are allocated and if they are full. This is only shown when Ventuz manually manages buffers, like for SDI streams. For an output stream, the buffers should be as full as possible, and when Ventuz is too slow the buffers are drained, a drop is only visible when the queue gets empty. For input streams, the buffers should be as empty as possible, when Ventuz is too slow the queue fills up so that Ventuz can process the images later on. Input frames are only dropped if the queue overflows.
Next is a list of audio cross-points. It shows the amount of delay that is associated with the cross-point. Delay is needed for windows audio devices or asynchronous inputs.
Movies
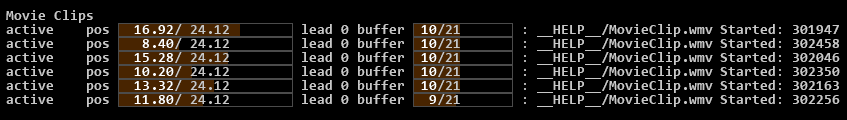
For each enabled movie related node, this shows information about the movie. This is especially important since most of the CPU load done by movies is not captured in the performance timing bars.
For each movie, the state, position, lead, buffering and file-name is shown.
The states are:
- error: the stream failed
- busy: Internal operation
- empty: No file was loaded
- loadmeta: loading metadata
- loadinfo: prepare playback
- active: normal playback
- pause: playback is paused
- seek: seeking
- waitstream: for Movie Stream nodes, waiting for a stream to receive
When multiple scenes are load into Ventuz, all the inactive scenes have still their audio player initalized. This may waste lots of GPU and CPU memory for the frame-buffers. Movies from inactive scenes have gray text instead of white. Ventuz will automatically take care to put movie clips from inactive scenes into pause mode, so that at least no effort is wasted in decoding frames that are never displayed.
The lead works like this: When the clip is not in async mode, and Ventuz runs in a cluster, it can happen that seeking to a position is not good enough because when the seek is complete, time has passed and the video is already too late. To avoid this problem, always pause the video, seek, wait a bit and then un-pause. If this is not done, Ventuz will notice the problem and automatically seek to a position slightly in the future, like when shooting skeet. A lead of 0 means no problem, 1 means that Ventuz considers leading but hasn't done it already, and higher numbers indicate increasing amounts of lead-time.
The buffers show how many buffers Ventuz has allocated and how many frames in the future are available. If these buffers run dry, increase the number of buffers for that movie. At the end of each line you can see the exact Cluster Clock when each Movie Started. Like the lead this is mainly useful to check syncronization of movies in a cluster. Next, Ventuz indicates with NVDEC if it uses the hardware decoding on the GPU and the used color space for the file.
In the Ventuz Designer, one can jump directly to a movie node by right-clicking on the name of a movie. A message is displayed to hint this:

Here the top movie is in an inactive scene (therefore it is displayed in gray, by right-clicking on it one can see where the node is hidden.
Tracking
When a camera tracking system is used, debug information can be shown. Ventuz will display the view and projection matrix, plus the K1 and K2 values and lens center shift in x and y for the lens distortion, all received from the tracking system.
![]()
Layer Processing
The layer engine will magically convert your layering into an optimized set of shaders. Each shader call can blend up to 8 layers together, if conditions are right.
To check how well the engine does in combining effects into single shaders, you can look ad the layer processing.
Each line represents:
- rendering a scene
- doing a multisample resolve after rendering a scene, if multisampling is enabled. This converts the multisampled rendertarget into a single-sampled texture that can be used by a shader.
- making a texture available for layer-blending (this is for free)
- doing a blit, using a shader.
- nop, no operation, a leftover from merging two blits together.
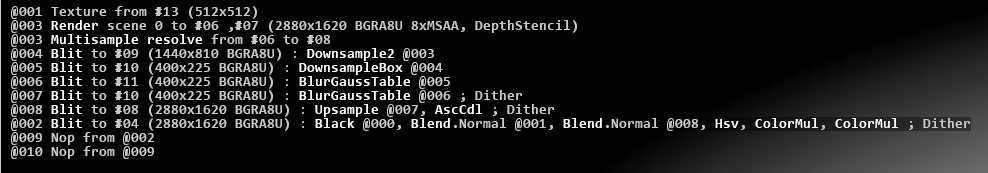
The log will reference textures and rendertargets with !#00, where 00 is replaced by a number assigned to the texture / rendertarget. Blits reference their sources by referencing to other lines in the log, using the notation @000. In the example you can see how a scene is rendered to color buffer !#06 and depth buffer !#07, then the color buffer is resolved to !#08 and the whole thing is referenced as line @003 in the first blit.
Some effect will create only a small shader snipped in one of the blits, like the grayscale and the color correct effect. Other effects, like the blur, will create multiple shaders, even changing depending on parameters. In the example above, the two downsample and the two blur blits are generated by a blur effect
Layer Blending will create Blend.XXXX blits, with XXXX being the blend-mode. The last blit line shows how multiple blends and other effects are merged into a single blit, the two nops being leftovers from the merge process.
As a rule of thumb: the less blits the better, and everything with blur in the name and the downsample box are especially expensive.
User Log
Shows the messages coming from the Log Node.
Watches
The watches show all currently watched properties in the scene tree. For more information see the Watches Editor page.
Label Outputs
Use this option to identify which output is using which GPU and which connector.


GPU's are counted as an array starting with GPU 0 and connector 0. For example a scene rendered on GPU 0 using the third connector would read GPU 0:2.
These can also differ depending on what they are currently rendering. Preview windows will always show the "Preview" flag.
Detailed Frame Timing Debug
Detailed Timing Header
TIMING :  00:01:29:42 0005382 : +007 Drift, 258 drops, 257 multi frame drops, 4 drop clusters, 0 Resoft, 0 Resyncs, 3 Disjoint, sr
Flip-Queue Histogram : 0:0 1:10 2:6 3:0 4:0 5:0 6:0 7:0 unchanged:4475 noinfo:2
- Drift : difference of the frame counter from the main display and the cluster clock. This is reset when the machine starts and the first time it is corrected by a network cluster clock. This allows to monitor how machines in a cluster drift apart - if they are not correctly synchronized.
- drops : total frames dropped
- multi frame drops: When dropping more than one frame, this counts this as a single drop
- drop clusters : all drops within 30 frames are counted as a "drop cluster", so that something like a "double-stutter" is counted only once. Often operating system activities are cause of such drop clusters.
- Resoft : "Soft Resync Queues" event, see below.
- Resyncs : "Resync Queues" event, see below
- Disjoint : "Disjoint Timestamps" event, see below.
- the letter 's' or '-'. Send ClusterClock. Indicates that the local timing is considered stable enough to send the cluster clock to other machines. During resync events or changes in the swap-queue the cluster clock is not send so to not confuse other machines
- the letter 'r' or '-'. Receive ClusterClock. Indicates that the local timing considered stable enough to receive the cluster clock from another machine.
Flip-Queue Histogram:
Analyses the queues of all outputs, and every frame it logs the most empty swap-queue. This allows to detect performance issues before a frame visibly drops: Especially if you configured a few extra buffers, you can see the queue decreasing in length without getting empty. This is an indication how "safe" you are running.
- unchanged : The same as last frame or better (more entries in the swap-queue). Only changes for the worse are reported
- noinfo : We could not get information from the operating system. Microsoft comments "Statistics are not reliable in many multiple monitor scenarios, as well as scenarios where other fullscreen apps are running." - which is not very helpful.
- 0..9 : the counter is increased when the swap-queue gets worse (emptier) than last frame. The information is taken after a new frame is added to the queue, so it should never be empty.
When running in the designer with render window and physical outputs, the render window will not be included.
Interpreting the Histogram:
If you see the slot "1" going up, you are having visible drops or are very near to dropping. Increases in higher slots should not be visible drops but temporary situations where rendering was slow but still some frames queued up for display, so no visible drop. By adding more extra-buffers things should shift to the safe side, at the cost of increased latency / lag. A good situation would be by adding two extra buffers, seeing the "1" and "2" slots at zero and the "3" slot showing some increases. You are running fine.
Detailed Timing Events
In addition to the header, the detailed timing will log events, basically whenever something went wrong.
Logs entries start with a timestamp:
WED-14:14 00:00:00:31 0000031
Day of week, Hour:Minute of the day, cluster-clock as timecode (HH:MM:SS:FF), Cluster-clock total.
- (+001) : dip 3 Queues 3 4 : one of the queues was not full, no drop
- (+003) : Queues 1 2 : one of the queues was empty, visible drop.
The number in brackets is the number of frames that should have passed. +1 is normal, +3 indicates that 2 frames were dropped.
- Disjoint Timestamps : Timing information from GPU is unusable. In the past this happened when GPUs change their clock frequency, but modern GPUs don't link timing information to core clock speed. Nowadays this indicates some operating system action.
- Soft Resync Queues (3) : If some GPU outputs go out of sync compared to others, the rendering is shown for two frames on some outputs to bring them back in sync. Number in brackets is the bitmask of the queues that needed synchronization, in this case 1+2 = queue 0 and queue 1.
- Resync Queues : Hard resnyc all GPU outputs by recreating all swap chains. Used as a last resource when all fails. Will cause flicker for exclusive fullscreen / swap sync outputs.
- Clusterclock adjusted from network by XXX : another machine corrected the clusterclock.
- clusterclock jumped : if clusterclock changes by more than 1000 frames, this is logged. Usually result of adjustment from network.
- GHOSTDROP Present Error GetLastPresentCount Error FLWO Error Closterclock message are for internal debugging and support.
Force GPU Stall
Unfortunately, the GPU measurement is sometimes incorrect. Especially when the GPU isn't doing much, it might stall in the middle of the measurement, displaying a high GPU utilization while it is actually doing little. Enable the Stall GPU option: this will negatively effect frame-rate, but correctly tell whether CPU or GPU is the bottleneck.
History Mode and Pause
To see spikes in performance better, enable the History Mode with the drop-down box. Pressing the pause key on keyboard will pause and continue the update of the bars. When the history mode is on and pause mode is on, use the page-up and page-down keys to scroll. Pressing the control key will scroll faster.
The numbers before the lines are the last three digits of the cluster clock
Interpreting GPU Measurement
When analyzing performance, the first thing to notice is whether it is the CPU or GPU that is limiting Ventuz performance.
Unfortunately, the GPU measurement is sometimes incorrect. Especially when the GPU isn't doing much, it might stall in the middle of the measurement, displaying a high GPU utilization while it is actually doing little. Enable the Stall GPU option: this will negatively effect frame-rate, but correctly tell whether CPU or GPU is the bottleneck.
Accumulated Bars Versus Detailed Timeline
By default, the display uses accumulated bars. When this is disabled, the bars show the exact timing as it happens on the CPU or GPU, and not just accumulated values. Also, one can see the various periods where the CPU is possibly waiting for the GPU (blue "idle" bars). In this mode, one can also see how the bars are stacked: ContentValidation and HierarchyValidation are stacked on top of Validation, which shows the total time including what is stacked on top.
Performance Impact of Measurement
Such detailed performance measurement is not for free, and especially the "Stall GPU" option slows things down. When the performance monitor is completely disabled, or the timing section is disabled, no data is recorded and therefore impact to performance is negligible. You can see the difference by switching the timing section ("Performance" in the menu) on and off while keeping the system information on.
More information about how to interpret this below.
Scale To Preview
If working in Designer with RenderSetups of high resolution in Machine or Cluster Preview modes, the Performance Statistics rendering might get very tiny. To scale it up to the preview window size, enable this option.
Stats that may slow rendering
These statistics are gathered in a separate thread so not to harm rendering performance directly, but there can be side effects that effect system performance that are hard to pin down. These stats will also show the current sync board status if one is configured and detected.

The sync board status is only available for NVIDIA Sync boards!
Clear Timing Debug
Clears the history of the Detailed frame time debugging.
Resync Swap Queues
Use this button when the rendering gets out of sync, to force Ventuz trying to resync everything.
Per Output Stats
Define where and what kind of information should be displayed.
Show on all Outputs:
- Show information about everything configured on all outputs
Show only in preview window:
- Shows all configured information only on the Preview Window
Show on all outputs, only relevant:
- Only shows information corresponding to that output on that output
Logging
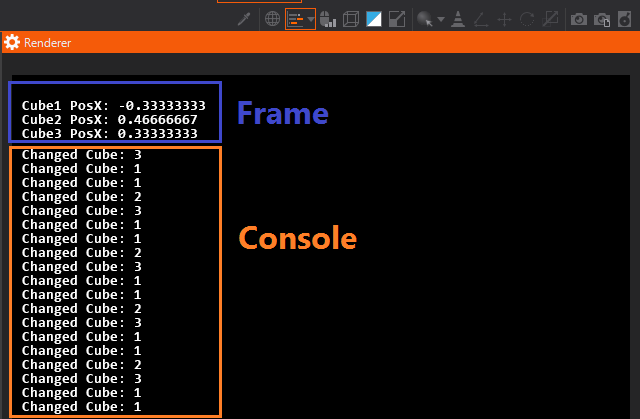
The performance monitor allows high performance logging. This is divided in two sections: Frame logging is replaced every frame, and can be used for watching values as they changed. This will look like the other performance statistics.
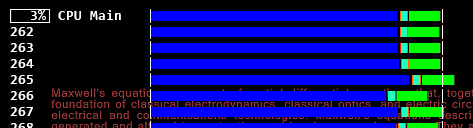
The console will work like a normal log file where messages printed will scroll endlessly. This is useful to capture events and state changes.
Use the Log Node or scripts to do frame and console logging.
Markup in Logging
The strings [sb:10/100], [mb:10/100], [lb:10/100] will paint a small, medium or long bar which will be filled for 10 of 100 parts (10 %). This bar looks like the Memory bars in the System Information section. The numbers will be printed as written, and the bar-length will be calculated by the division. So 33/100 will yield approximately the same bar-length as 1/3, but display different numbers.
To add text inside the bar, put it after the numbers : [lb:10/100MB]. A special mode allows number from -100 to 0 be displayed as decibel : [lb:-12/dB].
[! will print text brighter until ] is encountered, line in dim [! bright] dim.
The text-color can be changed with [tc:rgb] and [tc:rrggbb], where r, g and b must be replaced by web-style hex-colors. Again, the text in the brackets will be effected. Example: white [tc:ff0000 red] white.
When logging, c# will convert \n to linefeed (ASCII 10) and \f to formfeed (ASCII 12). Linefeeds will work normally, no \r carriage return (ASCII 13) is needed. Formfeeds will insert a half-sized linefeed. This is used between the sections of the performance statistics.
The codes \\, \[ and \] are parsed by the logging system and can be used for escaping. Other uses of the backslash will print the backslash normally. So in a c# script, one can write \\[ to escape a [.
When getting clever with markup, it might be a good idea to check in the render window and the web interface if both sides interpret the markup correctly.
Logging Limits
When using resolutions larger than HD, it becomes noticeable that the console logging area is limited to 238 x 96 characters. Frame logging is limited to 8095 characters total.
Performance Measurement via Script
Logging
For frame-logging use Ventuz.Kernel.Tools.PerfMon.PrintFrame . This information will be overwritten every frame.
For console-style logging use Ventuz.Kernel.Tools.PerfMon.PrintConsole.
All this logging is high-performance and when the performance monitor is disabled, the only cost of this is the formatting of the string.
Performance Timing
This explains how to add custom colored-bars to the performance timing.
First, a token must be created as a static member:
public static Ventuz.Kernel.Tools.PerfMon.Token Script1 =
    new Ventuz.Kernel.Tools.PerfMon.Token("Script1", 0xff8000);
The token has a name and a color. The color is given as hex web-color in RRGGBB format.
To measure something, use the token:
using(Script1.MeasureCpu)
{
    System.Threading.Thread.Sleep(3);
}
Example
Here is a complete example:
using System;
using Ventuz.Kernel;
using Ventuz.Kernel.Tools;


public class Script : ScriptBase, System.IDisposable
{
    private bool changed;

    public Script()
    {
    }

    public virtual void Dispose()
    {
    }

    // Token for Performance Timing

    public static PerfMon.Token Script1 =
        new PerfMon.Token("Script1", 0xff8000);

    public override void Validate()
    {
        changed = true;

        // Logging that will be overwritten every frame

        PerfMon.PrintFrame("Hello World\n");

        // Logging that will spam the console

        PerfMon.PrintConsole("LogLogLog\n");

        // wait a few milliseconds, and add a bar to timing

        using(Script1.MeasureCpu)
        {
            System.Threading.Thread.Sleep(3);
        }
    }

    public bool OnEnable(int arg)
    {
	Ventuz.Kernel.Tools.PerfMon.ConsoleLogEnabled = true;
	Ventuz.Kernel.Tools.PerfMon.FrameLogEnabled = true;
	return false;
    }

    public bool OnDisable(int arg)
    {
	Ventuz.Kernel.Tools.PerfMon.ConsoleLogEnabled = false;
	Ventuz.Kernel.Tools.PerfMon.FrameLogEnabled = false;
	return false;
    }

    public override bool Generate()
    {
        if (changed)
        {
            changed = false;
            return true;
        }

        return false;
    }
}
To make this example work, add an integer input to the C# script node and connect it to the cluster-clock output of the SystemID node. This will update the script every frame, although the value of cluster-clock is ignored.
Interpreting the Performance Timing
The Relation Between Main Thread and CPU Percentage
Assume a computer with a 4 core processor with hyper-threading. That makes 8 logical threads.
If a Ventuz scene takes 60% on the Main Thread, and no other time-consuming tasks are done (movie replay, heavy load on the DirectX driver), the CPU percentage should show ca. 7%, as the CPU is able to run 8 threads at the same time, and one of these threads is at 60% load.
Now, hyper-threading is not perfect. One can expect a 50% performance boost through hyper-threading at best, making it feel more like a 5-6 core than an 8 core machine. Still the CPU percentage display will consider all threads the same, as the actual performance boost is highly depending on the application.
Monitoring Movie Playback Performance
The movie playback does not show on the Main Thread. But it shows in the following way:
- The CPU percentage includes all video decoding.
- The status of each movie player can be displayed. Check if there are more active movie players than expected, or if movie players are switched on and off unnecessarily.
- Transfering the image from the CPU where it is decoded to the GPU and performing the color space conversion takes some time on the GPU, displayed as dark-green bar in the performance timing.
When playing low frame-rate video (24 or 30 fps) on full frame-rate outputs (50 or 60 fps), the GPU processing is not performed every frame. Turning on the History option for the performance timing reveals this: The GPU processing is done only every second or third frame. Be aware that while the average GPU load may be below 100%, individual frames may spike beyond the 100% mark.
Why is my Audio Delay so big?
In the AV Inputs/Outputs section, the delay of the audio crosspoints is displayed. This delay is inserted automatically by Ventuz to have some buffer when audio devices do not deliver data completely synchronous. Lets consider an example where an audio crosspoint goes from SDI-In to SDI-Out for a refresh rate of 59.94 Hz (Interlaced). The delay will be quite larget. What's going on here?
- Most likely the input is set to "autodetect". So Ventuz must assume the longest possible frame to buffer.
- If the framerates match perfectly, the buffer must hold exactly one frame. If they don't match, the buffer must hold the duration of both input plus output frame to handle worst case scenarios.
- If the input has the same framerate as the output, is genlocked, and set to synchronous, the delay will be either 2 or 0 samples.
- If the framerate is a 1000/1001 timing like 59.94 Hz (drop frame timing), a 2 samples buffer must be inserted because input and output might in a different phase when it comes to audio-frame lengths.
- When using Blackmagic boards, an extra video-frame of audio-delay is inserted. this is because unlike all other supported vendors, the Blackmagic SDK handles audio and video with separate timing.
So for shortest delays:
- don't use autodetect, specify video format manually
- have input and output at the same frame-rate (but may be different resolution)
- genlock input and output and set input to "synchronized"
- If you have the choice, use a timing without drop-frames.
Explanation of the Various Bars
Red(ish): Validation
- Validation : update bindings and nodes
- ContentValidation : content nodes
- HierarchyValidation : hierarchy nodes
- ResourceLoad : Sending resources (Texture, Geometry) from CPU to GPU.
Green(ish): Rendering
- RenderSetupBegin : Overhead before rendering can start
- RenderSetupEnd : Overhead after rendering has finished. This includes Warping.
- Render : walk the hierarchy nodes and find out what needs to be rendered (recording)
- Main : render the recording for the main rendering pass
- Mirror : render the recording for simple mirrors (no rendertarget)
- FxMirror : render the recording for effect mirrors (with rendertarget)
- CubeReflection : render the recording 6 times to build a cubemap reflection
- Shadowmap : render the recording for spot and directional shadows
- PointShadowmap : render the recording 6 times to build a cube-shadow-map.
- BoundBoxCalculation : bounding box calculation needed to determinate the size of directional shadowmaps.
Some shaders get special colors:
- Glow : Glow node
- BlurTextureSimple : Blur Texture Simple node
- HLSLShader: HLSL Shader node
- TextRendering: Text nodes
- MovieClip : CPU to GPU transfer and color space conversion during movie replay
Blue(ish): Idle
The Idle markers are only shown when Accumulated Bars is switched off.
- Present: wait for next frame.
- PreventD3DQueuing: wait for GPU to prevent the GPU from queuing up multiple frames.
- ResourceLock : wait for GPU to have access to some GPU resource (Texture, Geometry)
- Blit : A CPU stall that can occur in RenderSetupEnd. This is just an artifact of the measurement method.
- HardGpuStall : force synchronization of CPU & GPU when GPU Stall option is enabled.
- BeginVideo : waiting for video at the start of a frame
- EndVideo : waiting for video at the end of a frame
Yellow(ish): Postprocessing
- PreparePostProcess: Analyze effects & layers and figure out how to combine various shaders
- PostProcess: actually execute the postprocessing
- Some postprocessing shaders take longer than others and are marked individually
- Blur: Shaders in postprocessing that blur the image
- Downsample: Shaders in postprocessing that downsample the image to trade of quality for speed for the blurring.
- DoF: Shaders that implement depth of field.
Cyan(ish): Resource Generation
- ResourceGen : A resource gets update, and is none of the below:
- TextureResourceGen : Texture resource update
- TextResourceGen : Text resource update : this happens when text or layout changes
- GeometryResourceGen : Geometry resource update
- XMLResourceGen : XML/XPath/XSLT resource update
- ShaderResourceGen : Shader resource update
Video Process:
- InputHandling : Processing for Inputs, excluding DMA and colorspace conversion
- InputDma : DMA transfer for input streams
- InputColorSpace : Color space conversion for input streams
- OutputHandling : Processing for Outputs, excluding DMA and colorspace conversion
- OutputDma : DMA transfer for output streams
- OutputColorSpace : Color space conversion for output streams
- EndFieldGpuStall : Synchronization between CPU and GPU at the end of a frame
- WaitForFrame : Processing during waiting for frame (for all streams)
- Wait : Idle time during waiting for frame (this time is used by other threads)
- FinishFrame : Processing at the end of a frame (for all streams)
Other
- Runtime (gray) : The Ventuz Runtime. All major processing should have it's own color, this catches smaller tasks that seemed unimportant to measure individually
- no bar (transparent) : When in Accumulated Bars mode, the times do not add up to 100%. These gaps are time spend with other processes or in the user interface. Especially in the designer, a lot of time may be spend in the user interface when there is mouse-movement.
- InputProcessing (gray) : processing of touch events.
- PerfMon (gray) : performance monitor rendering.